ShmoopTube
Where Monty Python meets your 10th grade teacher.
Search Thousands of Shmoop Videos
Statistics and Probability Videos 134 videos
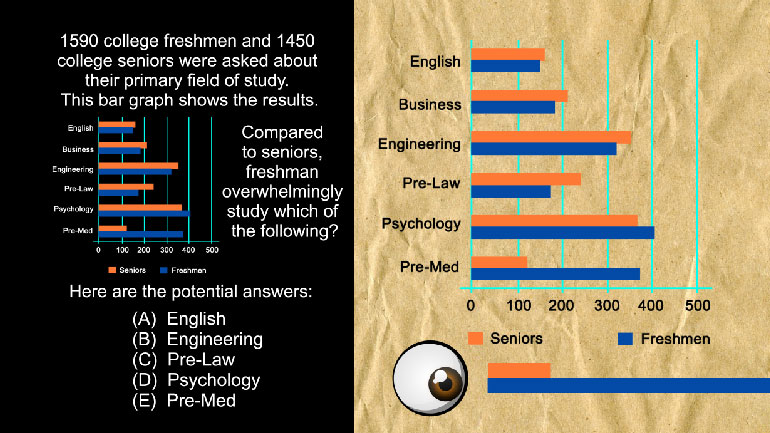
Statistics, Data, and Probability I: Drill Set 3, Problem 4. How many different avatars can be created based on the given options?
Statistics, Data, and Probability II Drill 3 Problem 2. Which two sports together make up for the preferences of more than half of all those w...
Z-Scores 559 Views
Share It!
Transcript
- 00:07
Z-Scores! Uh, no. Z-Scores! Uh, no we don't just have an accent when we're saying it.
- 00:14
It really is Z-Scores. All right, so, let's get to zhe problem.
- 00:19
What are Z-Scores, and where does the catchy name come from?
- 00:23
The Z in Z-Scores refers to the Z distribution,
- 00:27
another name for the normal distribution. Distant cousin of the...
Full Transcript
- 00:31
weird distribution. That's because Z-Scores tell us how many standard deviations...
- 00:37
a data point is above or below an average, when placed on a...
- 00:43
standard normal curve, or a curve with a mean zero and standard deviation of one. It looks like...
- 00:49
this. What's useful about these Z-Scores is that we can use our handy-dandy...
- 00:55
probability Z-Score chart to find the probability under the curve of any specific data point.
- 01:01
And this is super useful, because we can find the likelihood of a specific data point occurring, just by...
- 01:07
knowing its Z-Score. But the data we're given sometimes doesn't come from a standard normal distribution,
- 01:13
which means we have to standardize our data first before we can use our chart. Now here's a formula to...
- 01:19
help us standardize our data. Z equals the point we're interested in. X - μ,
- 01:25
the mean, all over the standard deviation. This squiggly line thing here is standard deviation.
- 01:31
Suppose we had a patient take a reading abilities test.
- 01:37
The patient scores a 46 on the test, and the mean of the test scores is 52. With a standard...
- 01:43
deviation of four. Got it? Well, we want to find the percentile of the...
- 01:49
patient's score. First, we have to standardize the data, and we'd use our little handy-dandy formula...
- 01:55
and plug in some numbers. We get Z equals 46 minus 52 over 4, which is negative...
- 02:01
six over four, which is negative three halves, or negative 1.5. A negative...
- 02:07
Z-Score means our point is left of, or smaller than,
- 02:11
the mean, while a positive Z-Score means our...
- 02:14
number is to the right of, or larger than, the mean.
- 02:17
Well, yeah, we already knew that when we were told that...
- 02:20
our point was 46 and our mean was 52.
- 02:23
We figured that out okay. Our Z-Score is negative 1.5, so we can look at our chart, and we see that our...
- 02:29
percentage is 0.0668, or the 6.68th percentile.
Related Videos
Statistics, Data, and Probability I: Drill Set 3, Problem 4. How many different avatars can be created based on the given options?
Statistics, Data, and Probability II Drill 3 Problem 2. Which two sports together make up for the preferences of more than half of all those w...
Statistics, Data, and Probability II Drill 3 Problem 3. One hundred twenty of those who were asked preferred what sport?
If you're looking for tips on how to score more free samples at Yogurtland, you've got the wrong video.


