ShmoopTube
Where Monty Python meets your 10th grade teacher.
Search Thousands of Shmoop Videos
Statistics and Probability Videos 134 videos
Statistics, Data, and Probability I: Drill Set 3, Problem 4. How many different avatars can be created based on the given options?
Statistics, Data, and Probability II Drill 3 Problem 2. Which two sports together make up for the preferences of more than half of all those w...
Stem and Leaf Plots 8803 Views
Share It!
Description:
This video covers how to set up a stem and leaf plot and use it to find the mean and median of a set of numbers.
Transcript
- 00:04
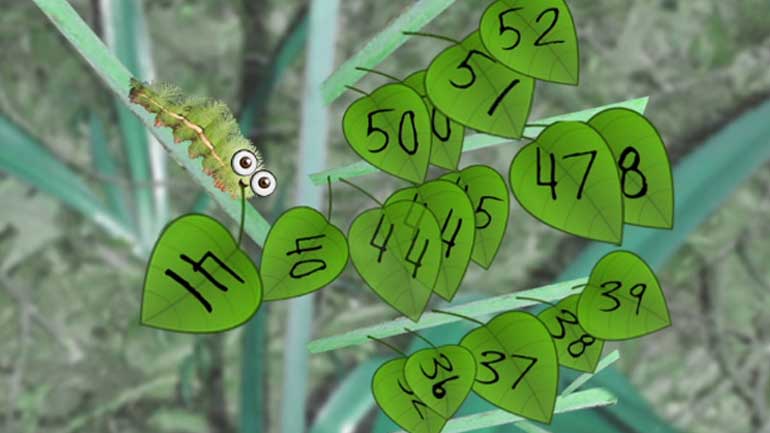
Stem and Leaf Plots, a la Shmoop. Kathryn R. Pillar lives on a plant stem.
- 00:11
Don't ask us why, but she insists on arranging all her leaves into stem-and-leaf plot formations
- 00:15
before she eats them. However, every time there's wind, her leaves
- 00:20
get blown out of sequence. Here are the leaves, by number:
- 00:28
Okay... before we get started... what in the world is a stem-and-leaf plot?
Full Transcript
- 00:32
It's basically a way of organizing data that shows the relationship of each value to the
- 00:37
other values. To make a stem-and-leaf plot, create the "stem"
- 00:42
by listing the digits with the largest place value to the left of a vertical line.
- 00:47
In this case, we have the tens place...5 for 50, 4 for 40, 3 for 30, and 2 for 20.....
- 00:55
The remaining digits... those in the ones place...
- 00:58
...will be written to the right of the vertical line to create and organize the "leaves."
- 01:04
Now that Kat has finished organizing, she decides that she wants to eat the middle leaf
- 01:07
first. To find the middle leaf, also known as the
- 01:12
median... ... we can simply cross out one number from
- 01:14
the top and bottom until we reach the middle number.
- 01:17
Unfortunately, Kat has found that the median lands between 47 and 45.
- 01:22
She doesn't have a leaf labeled "46".. ...so she settles for the next best thing...
- 01:28
the leaf with the average value. To find the average, or mean, we just have
- 01:33
to add up the numerical values of all the leaves...
- 01:36
... and divide by the total number of leaves. All of them added together equals 760. When
- 01:43
we divide that by the total number of leaves... 18... it gives us roughly 42.2.
- 01:50
Finally, Kat can lie down and try to sleep off her food coma.
Related Videos
Statistics, Data, and Probability I: Drill Set 3, Problem 4. How many different avatars can be created based on the given options?
Statistics, Data, and Probability II Drill 3 Problem 2. Which two sports together make up for the preferences of more than half of all those w...
Statistics, Data, and Probability II Drill 3 Problem 3. One hundred twenty of those who were asked preferred what sport?
If you're looking for tips on how to score more free samples at Yogurtland, you've got the wrong video.


