ShmoopTube
Where Monty Python meets your 10th grade teacher.
Search Thousands of Shmoop Videos
Statistics and Probability Videos 134 videos
Statistics, Data, and Probability I: Drill Set 3, Problem 4. How many different avatars can be created based on the given options?
Statistics, Data, and Probability II Drill 3 Problem 2. Which two sports together make up for the preferences of more than half of all those w...
SAT Math 3.5 Statistics and Probability 256 Views
Share It!
Description:
SAT Math 3.5 Statistics and Probability
- Data Analysis / Data Interpretation
- Product Type / SAT Math
- Statistics and Probability / Summarize, represent, and interpret data on two variables
- Statistics and Probability / Summarize, represent, and interpret data on two variables
- Statistics and Probability / Interpret linear models
- Statistics and Probability / Make inferences and justify conclusions from sample surveys, experiments, and observational studies
- Functions / Interpret expressions for functions
- Statistics and Probability / Summarize, represent, and interpret data on two variables
- Statistics and Probability / Interpret linear models
- Statistics and Probability / Summarize, represent, and interpret data on two variables
- Statistics and Probability / Summarize, represent, and interpret data on two variables
- Statistics and Probability / Make inferences and justify conclusions
- Problem Solving and Data Analysis / Data collection and evaluation
Transcript
- 00:02
Time for your daily dose of Shmoop. Open wide!
- 00:06
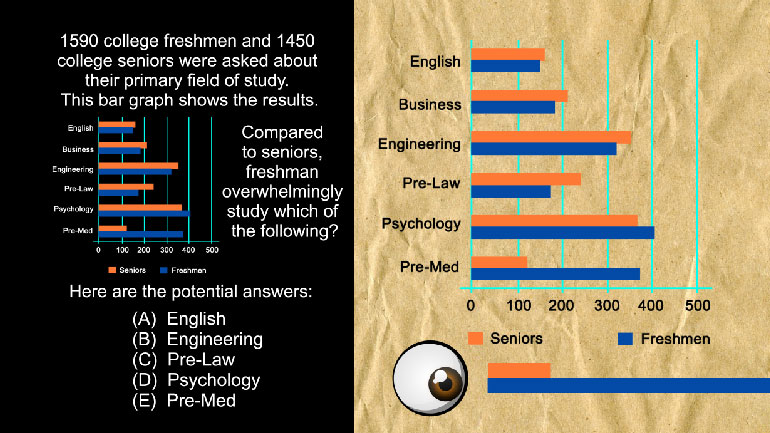
1590 college freshmen and 1450 college seniors were asked about their primary field of study.
- 00:12
This bar graph shows the results.
- 00:14
Compared to seniors, freshman overwhelmingly study which of the following?
- 00:18
And here are the potential answers…
Full Transcript
- 00:21
Ok, this question is testing whether or not we know how to read a graph.
- 00:25
Since freshmen are depicted in blue, and seniors are depicted in orange, as shown by the key on the right…
- 00:30
This kinda key.
- 00:33
…we need to look for the field of study where the blue bar far exceeds the length
- 00:36
of the orange bar to find which subject freshmen overwhelmingly study compared to seniors.
- 00:42
The subject that fits this description better than any other field of study in the graph is PreMed.
- 00:48
It’s…pretty obvious that this blue bar is way longer than this orange bar.
- 00:52
The correct answer is (E).
Related Videos
SAT Math 2.1 Geometry and Measurement. What is the measure of angle z in terms of x and y?
In 2014, the unemployment rate of one county in California was 7%. In another county, the unemployment rate was 11%. Which of the following express...
Angela is making cookies for a bake sale. She expects each batch of her cookies to sell for $40. It costs her $10 to make one batch of cookies, and...


