ShmoopTube
Where Monty Python meets your 10th grade teacher.
Search Thousands of Shmoop Videos
Playlist CAHSEE Math Test Prep: Statistics, Data, and Probability II 30 videos
CAHSEE Math Statistics, Data, and Probability II: Drill 1 Problem 1. Which of the following tables best represents the relationship between the val...
Statistics, Data, and Probability II Drill 1, Problem 2. Based on the chart, which of the following statements is true?
CAHSEE Math Statistics, Data, and Probability II: Drill Set 1, Problem 3. Based on the following, which of the following statements is true?
CAHSEE Math 6.2 Statistics, Data, and Probability II 170 Views
Share It!
Description:
Statistics, Data, and Probability II: Drill Set 6, Problem 2. Which of the following statements is the most accurate, based on the graph?
Transcript
- 00:03
Alright, let's put this question on your plate and eat it.
- 00:07
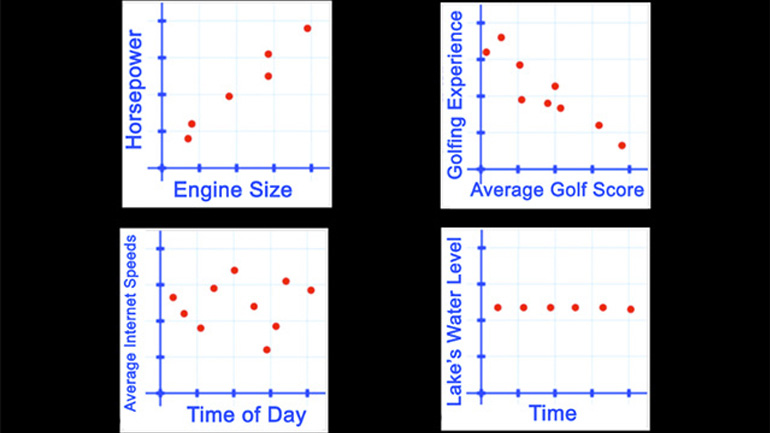
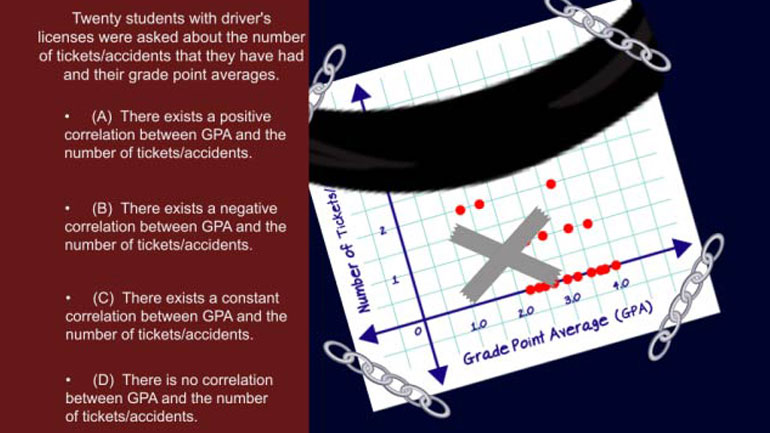
Twenty students who have driver's licenses were asked about the number of tickets and/or
- 00:10
accidents that they have had and their grade point averages.
- 00:14
The students without driver’s licenses were not polled, mainly because…
- 00:17
well, they shouldn’t be driving.
Full Transcript
- 00:19
The results of the survey is shown in the following graph.
- 00:23
Which of the following statements is the most accurate, based on the graph?
- 00:27
And here are the potential answers...
- 00:36
Wow, gnarly graph.
- 00:38
Really hard to figure out what it’s telling us, as there’s no clear pattern.
- 00:44
So let’s just go through one by one…
- 00:47
A. “There exists a positive correlation between GPA and the number of tickets/accidents.”
- 00:52
Hm… the smarter kids get more tickets?
- 01:01
Doesn’t make much sense… and it’s not supported by the graph.
- 01:04
The points would be going up and to the right if that were the case…moving on...
- 01:08
B. “There exists a negative correlation between GPA and the number of tickets/accidents.”
- 01:14
Would make more sense, but… same deal. Not a clear-cut pattern from the data here.
- 01:19
C. “There exists a constant correlation between GPA and the number of tickets/accidents.”
- 01:25
No – nothing is ‘constant’ about this graph.
- 01:27
Other than our constant confusion as to what it’s trying to say.
- 01:34
D. “There is no correlation between GPA and the number of tickets/accidents.”
- 01:39
Yeah – this has to be it... there’s really NO correlation between much of anything here.
- 01:43
As hard as we may try to find one. So our answer is D.
- 01:46
As in… “Dumb people aren’t necessarily the worst drivers.”
Related Videos
Statistics, Data, and Probability II Drill 3 Problem 2. Which two sports together make up for the preferences of more than half of all those w...
Statistics, Data, and Probability II Drill 3 Problem 3. One hundred twenty of those who were asked preferred what sport?
CAHSEE Math: Algebra and Functions Drill 5, Problem 3. Solve the equation.
Statistics, Data, and Probability I: Drill Set 3, Problem 4. How many different avatars can be created based on the given options?
