ShmoopTube
Where Monty Python meets your 10th grade teacher.
Search Thousands of Shmoop Videos
Expository Texts Videos 28 videos


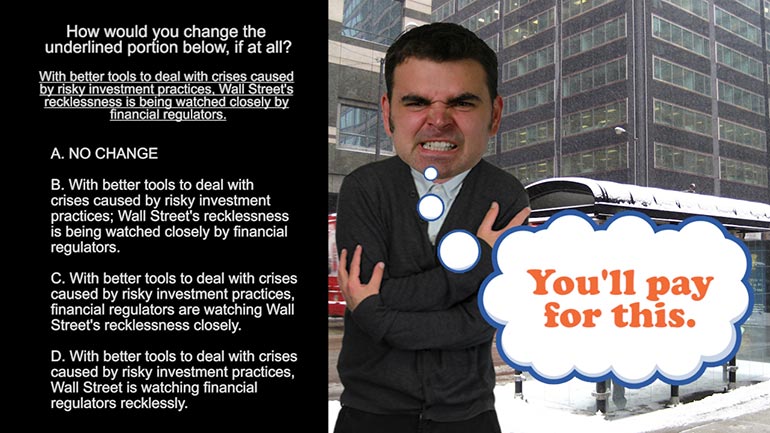


ACT English: Passage Drill 3, Problem 15. Which choice does the best job of summing up the main point of the article?


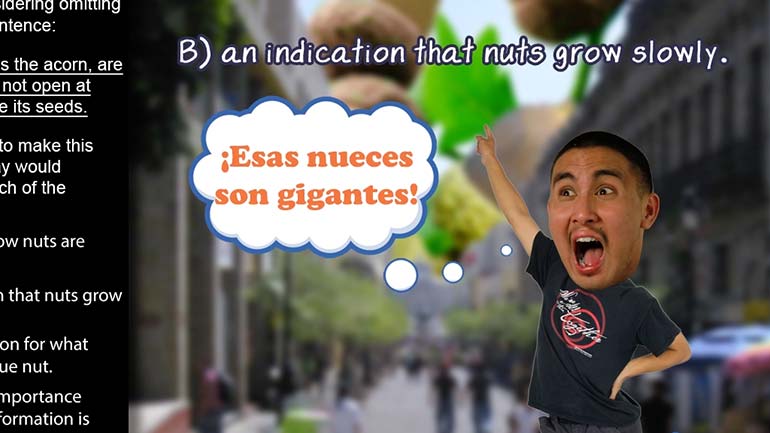
PSAT 1.22 Writing Diagnostic. Which choice results in the passage having the most appropriate concluding sentence?
Predicting Birth Dates 250 Views
Share It!
Description:
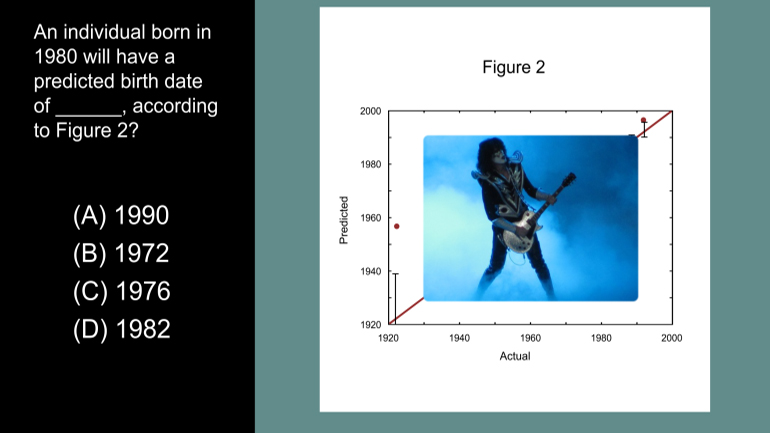
ACT Science Data Representation Passage: Drill 3, Problem 5. According to Figure 2, what birth date will be predicted for an individual actually born in 1980?
Transcript
- 00:03
Here's an unshmoopy question you'll find on a science exam somewhere in life...
- 00:07
Hope you're in a "reading" sort of mood.
- 00:09
Hit pause and familiarize yourself with the text and oh the pretty pictures...
- 00:27
An individual born in 1980 will have a predicted birth date of... what, according to Figure 2?
- 00:34
And here are the potential answers...
Full Transcript
- 00:44
Wow, bonus... this question already tells
- 00:46
us what figure we need to look at.
- 00:48
So if we scooch our eyeballs over to Figure 2...
- 00:51
...we can see that the predicted birth dates are pretty darn close to the actual birthdates...
- 00:57
...so we're looking for the year that's closest to 1980.
- 01:00
Out of all four answer choices, 1982 is the closest, so D is the right answer.
- 01:05
If we want to get fancy, the graph even shows us that the predicted values seem to be slightly
- 01:09
higher than the actual values.
- 01:12
And if we want to get really fancy...
- 01:14
...we can meet up tonight at Red Lobster. We call dibs on the Cheddar Bay Biscuits.
Related Videos
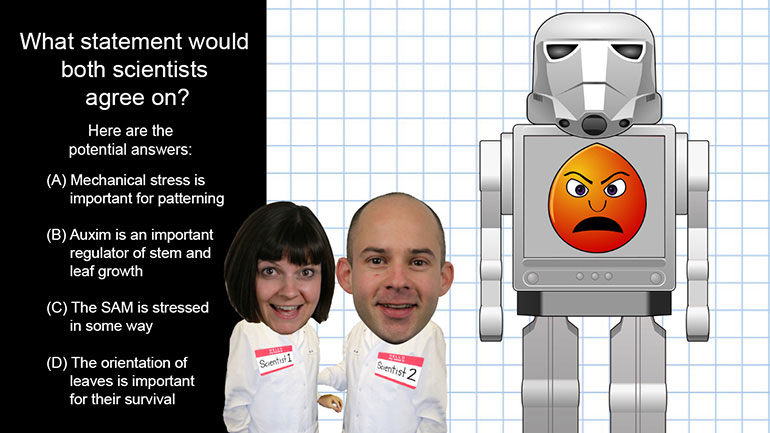
ACT Science: Conflicting Viewpoint Passage Drill 1, Problem 1. What statement would both scientists agree upon?
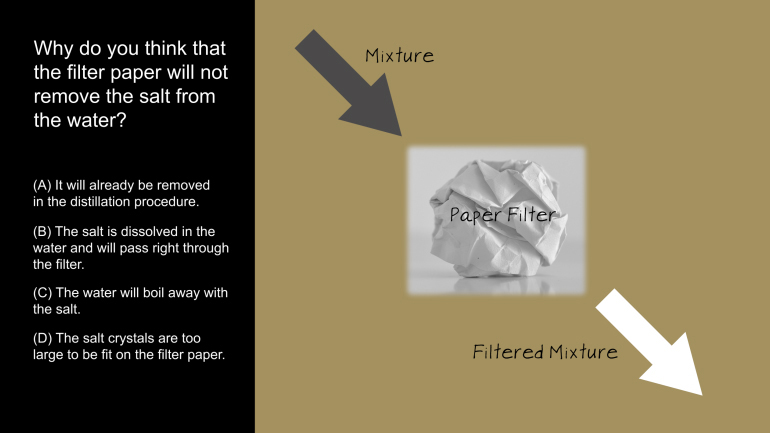
ACT Science: Research Summary Passage Drill 2, Problem 1. Why do you think that the filter paper will not remove the salt from the water?

ACT Science: Data Representation Passage Drill 1, Problem 2. Which of the following is a variable in Figure 1, but not in Figure 2?

ACT Science: Data Representation Passage Drill 1, Problem 1. What do the statistics in Figure 1 suggest?
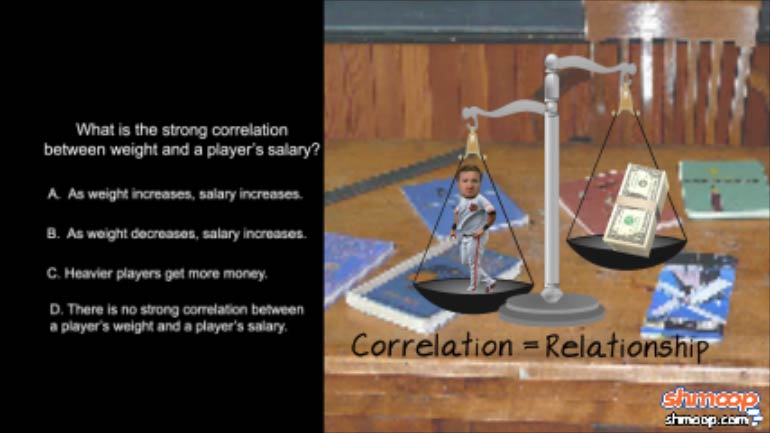
ACT Science: Data Representation Passage Drill 1, Problem 3. What is the strong correlation between weight and a player's salary?