ShmoopTube
Where Monty Python meets your 10th grade teacher.
Search Thousands of Shmoop Videos
Scientific Processes Videos 26 videos
ACT Science: Data Representation Passage Drill 2, Problem 9. What is the best conclusion from the data collected from Experiments 1-3?
ACT Science: Research Summary Passage Drill 1, Problem 6. Which of the following best states the scientists' hypothesis?
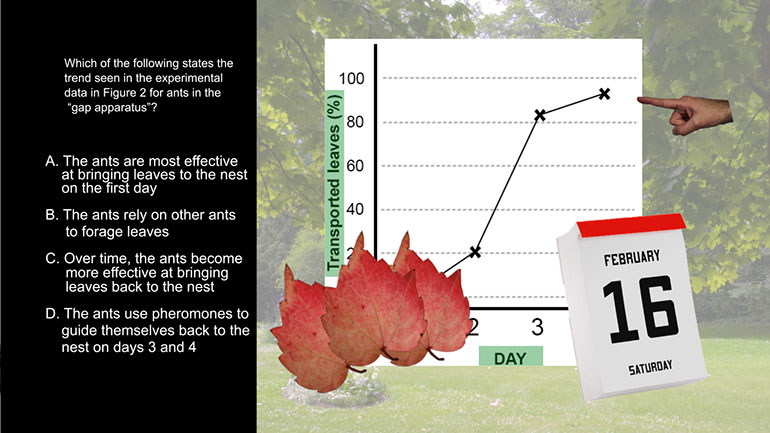
ACT Science: Research Summary Passage Drill 3, Problem 6. Which of the following statements can the scientists conclude from the experiment?
ACT Science 2.2 Data Representation Passage 246 Views
Share It!
Description:
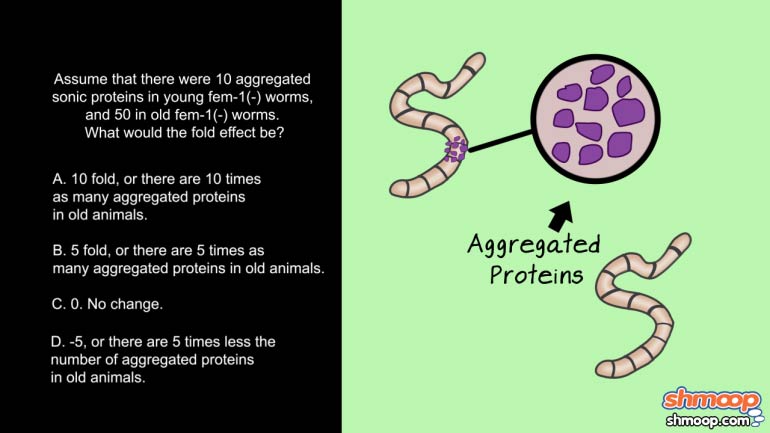
ACT Science: Data Representation Passage Drill 2, Problem 2. Compared to fem-1(-) worms, gon-2(-) worms will most likely have what?
Transcript
- 00:03
Here's your shmoop du jour: Brought to you by Joe's Bait and Tackle shop
- 00:08
They are the masters of bait!
- 00:36
Compared to fem-1(-) worms, gon-2(-) worms will most likely have:
- 00:41
And here are the potential answers:
- 00:46
This question is asking us to compare fem 1 worms and gon 2 worms.
Full Transcript
- 00:52
Our answer choices give us information about age-dependent protein aggregation, and Figure
- 00:57
1 shows us the fold change in protein aggregation between fem 1 and gon 2 worms.
- 01:03
So we know we should be looking at Figure 1 for our answer.
- 01:09
We notice that the fem -1 graph on the left has more data points associated with high
- 01:14
fold change than the gon -2 graph. This shows that on average, the amount of protein aggregation,
- 01:20
or fold change, is higher in fem -1 worms than it is in gon -2 worms.
- 01:30
So to answer the given question, gon-2 worms have LESS age-dependent protein aggregation.
- 01:35
Choice C is our answer!
Related Videos
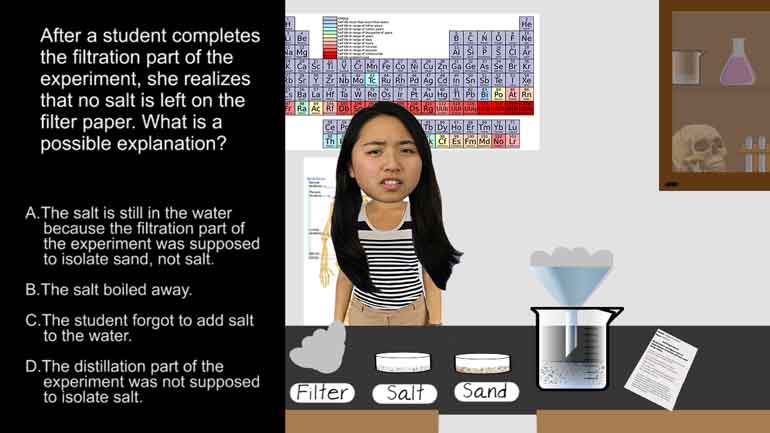
ACT Science: Research Summary Passage Drill 2, Problem 1. Why do you think that the filter paper will not remove the salt from the water?
ACT Science: Conflicting Viewpoint Passage Drill 1, Problem 1. What statement would both scientists agree upon?
ACT Science: Data Representation Passage Drill 1, Problem 1. What do the statistics in Figure 1 suggest?
ACT Science: Data Representation Passage Drill 1, Problem 2. Which of the following is a variable in Figure 1, but not in Figure 2?
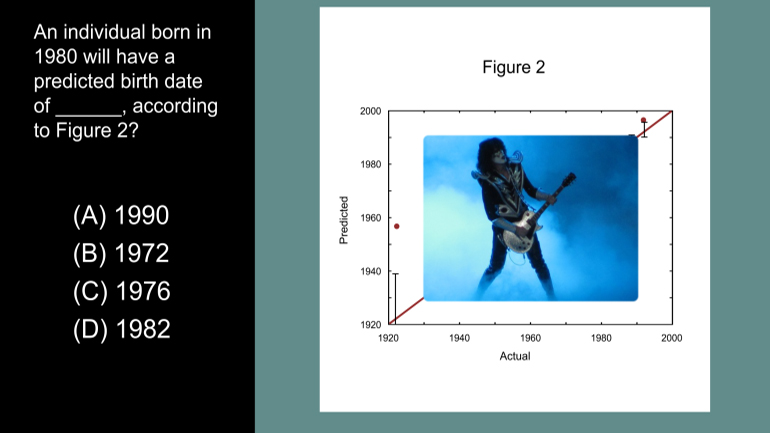
ACT Science Data Representation Passage: Drill 3, Problem 5. According to Figure 2, what birth date will be predicted for an individual actual...
