ShmoopTube
Where Monty Python meets your 10th grade teacher.
Search Thousands of Shmoop Videos
Scatterplots Videos
Play All
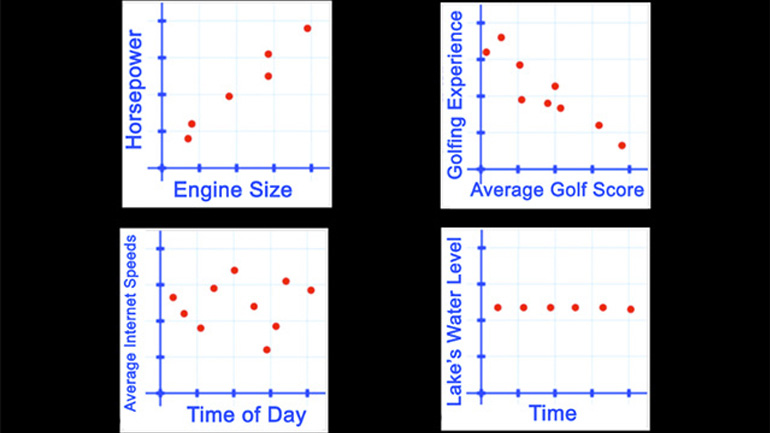
Statistics, Data, and Probability II Drill 4 Problem 1. Which of the following scatter plots represents a negative correlation between the data sets?
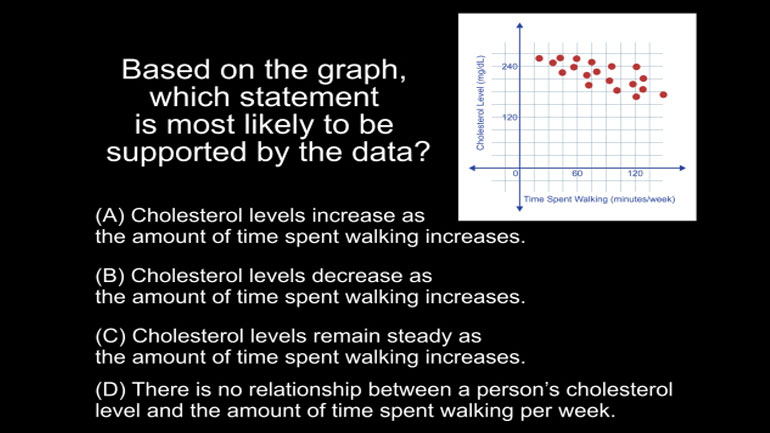
Statistics, Data, and Probability II Drill 4 Problem 2. Based on the graph, which statement is most likely to be supported by the data?
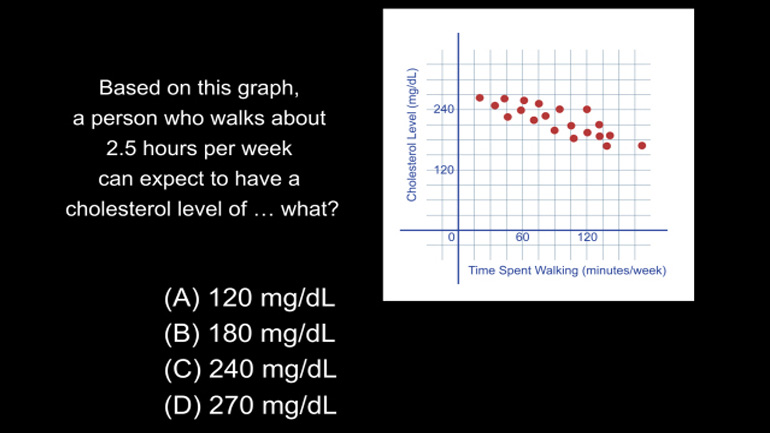
Statistics, Data, and Probability II Drill 4 Problem 3. Based on this graph, a person who walks about 2.5 hours per week can expect to have a...
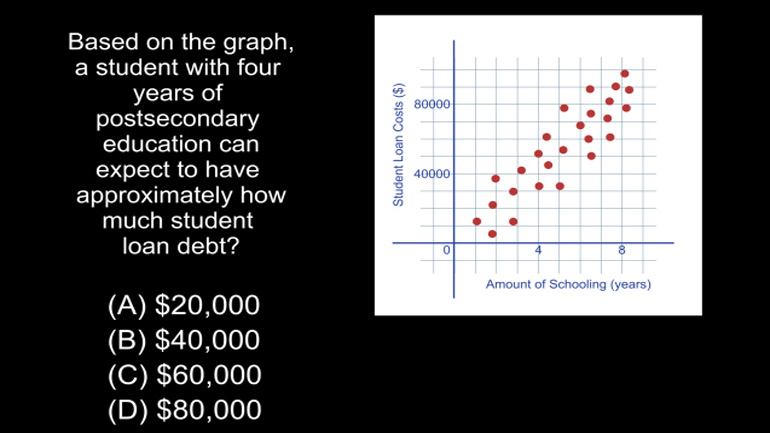
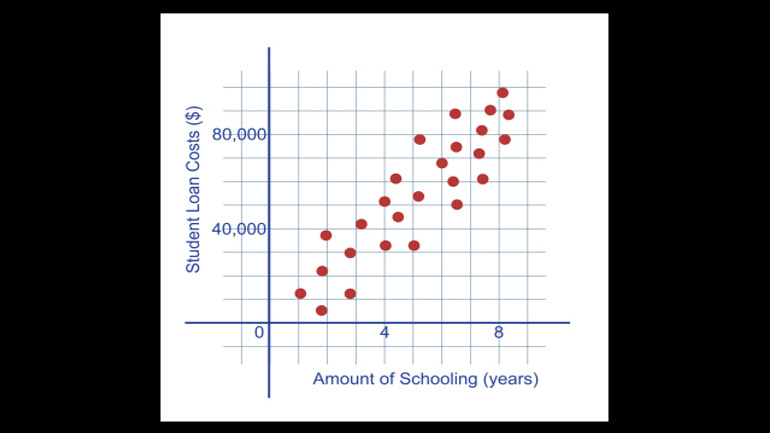
Statistics, Data, and Probability II Drill 4 Problem 4. Based on the graph, a student with four years of postsecondary education can expect to...
Statistics, Data, and Probability II Drill 4 Problem 5. Based on the graph, which of the following statements is true?

Statistics, Data, and Probability II Drill 5 Problem 1. Based on the data, a student who had missed 10 days of school can expect his GPA to be...

Statistics, Data, and Probability II Drill 5 Problem 2. Based on this data, a student who had missed 10 days of school can expect his GPA to be abo...

Statistics, Data, and Probability II Drill 5 Problem 3. Based on this plot, which of the following statements is the most accurate?

Statistics, Data, and Probability II Drill 5, Problem 4. Based on this plot, a person making $80,000 a year has been working at the company for how...