ShmoopTube
Where Monty Python meets your 10th grade teacher.
Search Thousands of Shmoop Videos
Statistics, Data, and Probability II Videos
Play All

CAHSEE Math Statistics, Data, and Probability II: Drill 1 Problem 1. Which of the following tables best represents the relationship between the val...

Statistics, Data, and Probability II Drill 1, Problem 2. Based on the chart, which of the following statements is true?

CAHSEE Math Statistics, Data, and Probability II: Drill Set 1, Problem 3. Based on the following, which of the following statements is true?

Statistics, Data, and Probability II: Drill Set 1, Problem 4. Which of the following pie charts correctly represents the data given in the table?

Statistics, Data, and Probability II Drill 1 Problem 5. How many movies in Tom's collection are dramas?
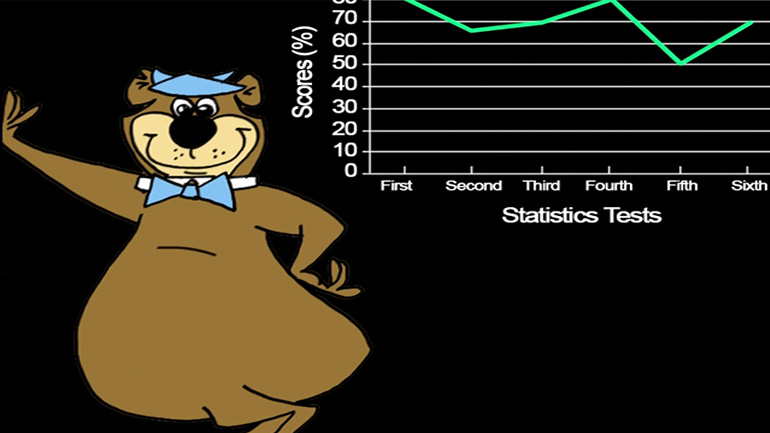
Statistics, Data, and Probability II Drill 2 Problem 1. Yogi's rate of success increased the most from when to when?
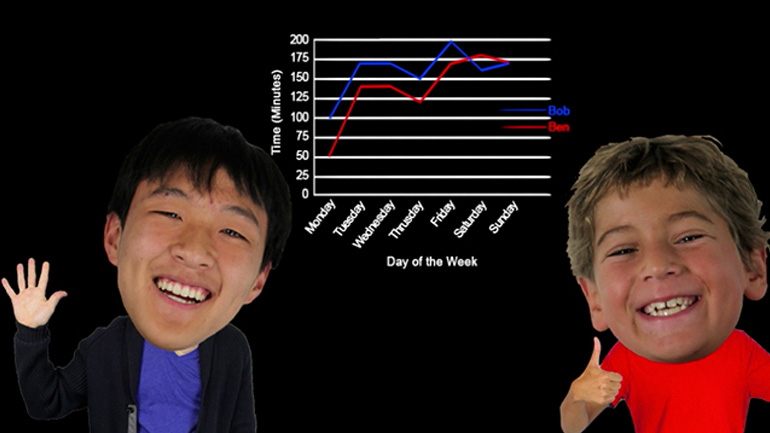
Statistics, Data, and Probability II Drill 2 Problem 2. Based on the graph, which of the following is correct?

Statistics, Data, and Probability II: Drill Set 2, Problem 3. Which statement is true based on this information?
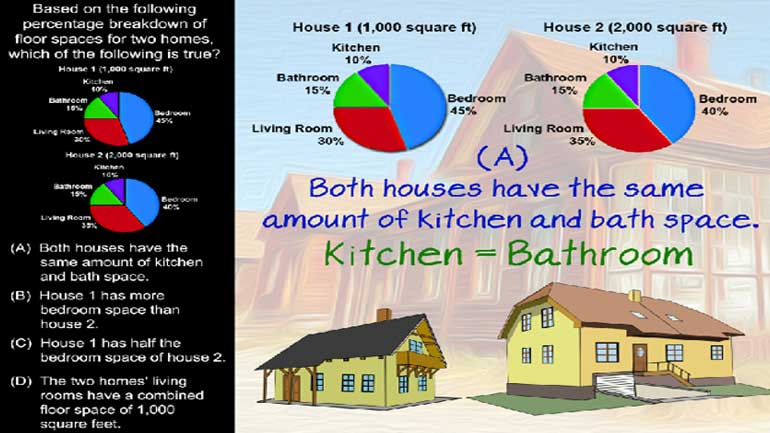
Statistics, Data, and Probability II: Drill Set 2, Problem 4. Based on the following percentage breakdown of floor spaces for two homes, which of t...
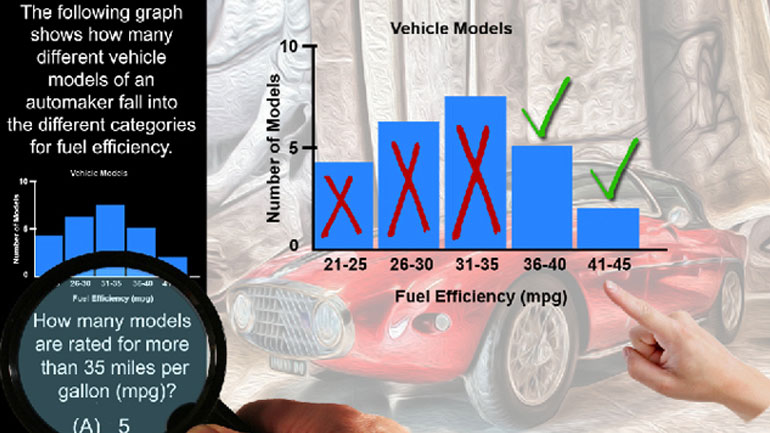
Statistics, Data, and Probability II: Drill Set 2, Problem 5. How many models are rated for more than 35 miles per gallon (mpg)?
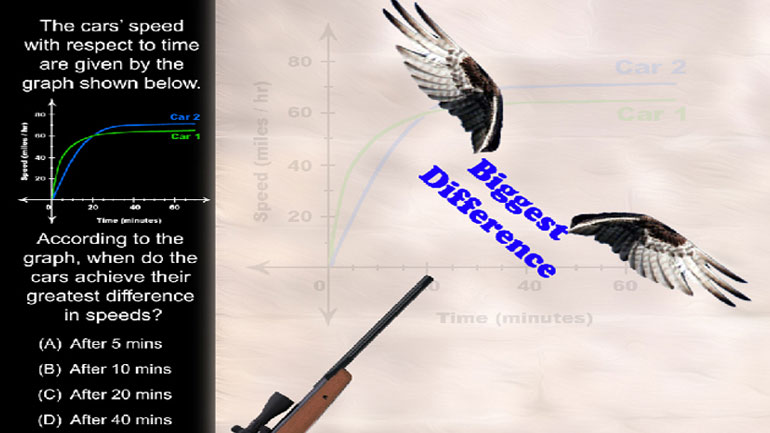
Statistics, Data, and Probability II Drill 3 Problem 1. According to the graph, when do the cars achieve their greatest difference in speeds?

Statistics, Data, and Probability II Drill 3 Problem 2. Which two sports together make up for the preferences of more than half of all those w...

Statistics, Data, and Probability II Drill 3 Problem 3. One hundred twenty of those who were asked preferred what sport?
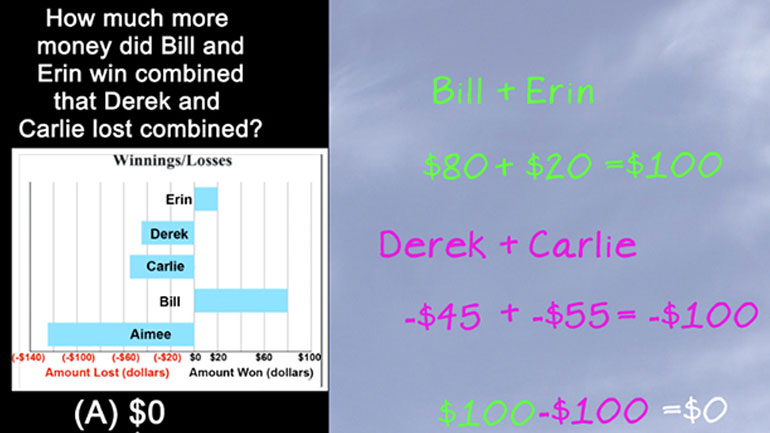
Statistics, Data, and Probability II Drill 3 Problem 4. How much more money did Bill and Eric win combined than Derek and Carlie lost combined?
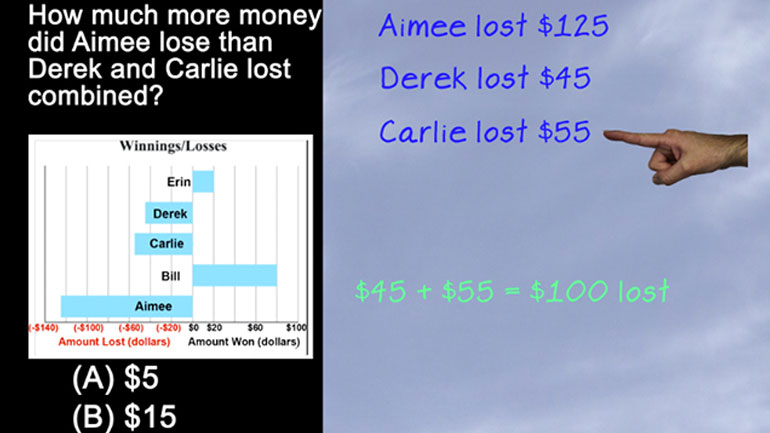
Statistics, Data, and Probability II Drill 3 Problem 5. How much more money did Aimee lose than Derek and Carlie lost combined?
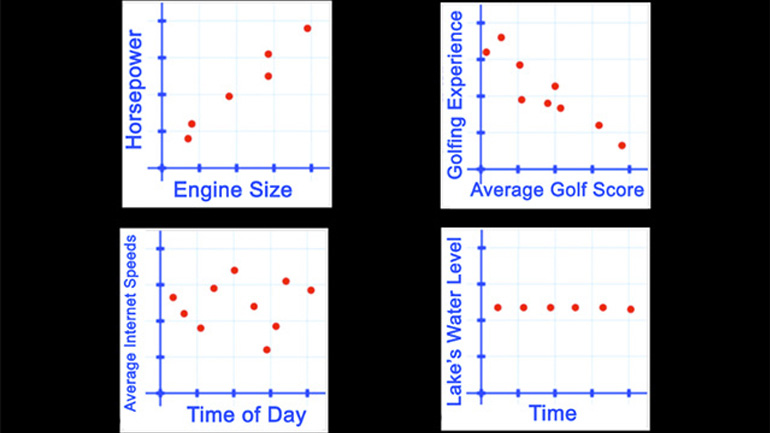
Statistics, Data, and Probability II Drill 4 Problem 1. Which of the following scatter plots represents a negative correlation between the data sets?
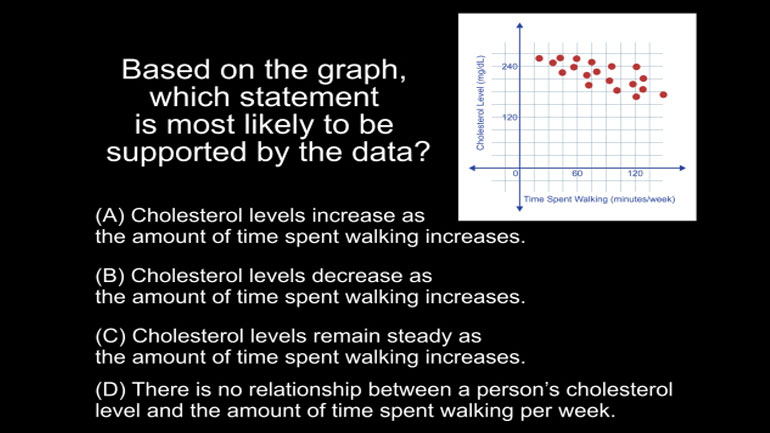
Statistics, Data, and Probability II Drill 4 Problem 2. Based on the graph, which statement is most likely to be supported by the data?
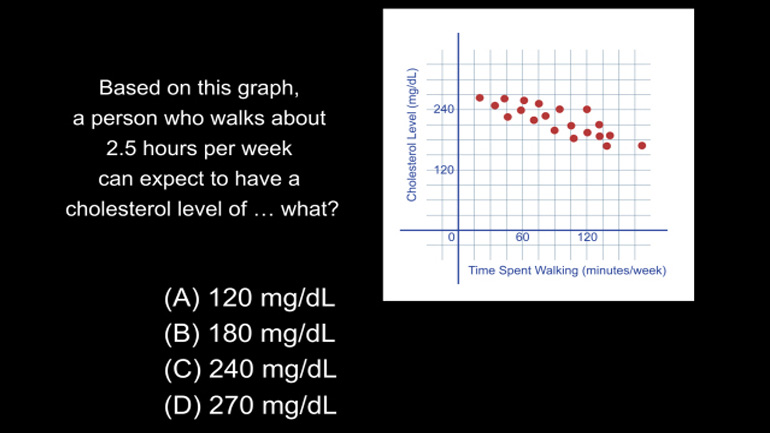
Statistics, Data, and Probability II Drill 4 Problem 3. Based on this graph, a person who walks about 2.5 hours per week can expect to have a...
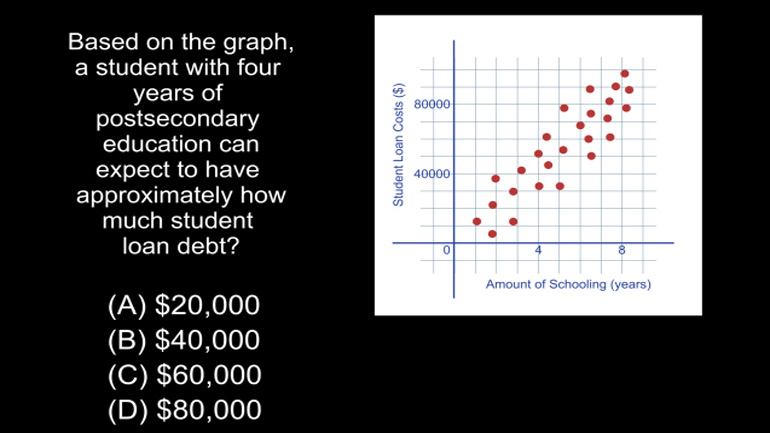
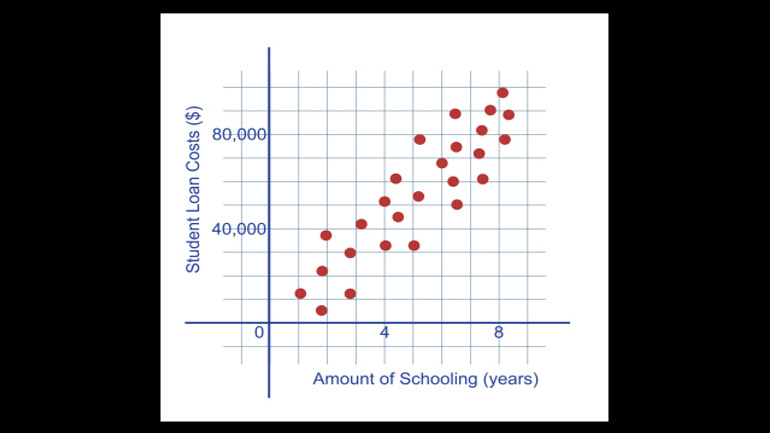
Statistics, Data, and Probability II Drill 4 Problem 4. Based on the graph, a student with four years of postsecondary education can expect to...
Statistics, Data, and Probability II Drill 4 Problem 5. Based on the graph, which of the following statements is true?

Statistics, Data, and Probability II Drill 5 Problem 1. Based on the data, a student who had missed 10 days of school can expect his GPA to be about what?

Statistics, Data, and Probability II Drill 5 Problem 2. Based on this data, a student who had missed 10 days of school can expect his GPA to be about what?

Statistics, Data, and Probability II Drill 5 Problem 3. Based on this plot, which of the following statements is the most accurate?

Statistics, Data, and Probability II Drill 5, Problem 4. Based on this plot, a person making $80,000 a year has been working at the company for how many years?

Statistics, Data, and Probability II Drill 5, Problem 5. If Bert purchased $15,000 in merchandise at wholesale prices, how much would he need to make in total sales to earn a 12% profit?

Statistics, Data, and Probability II Drill 6, Problem 1. Based on this graph, if ticket prices were to be slashed in half, the average attendance per game would be how much more than the original?
Statistics, Data, and Probability II: Drill Set 6, Problem 2. Which of the following statements is the most accurate, based on the graph?

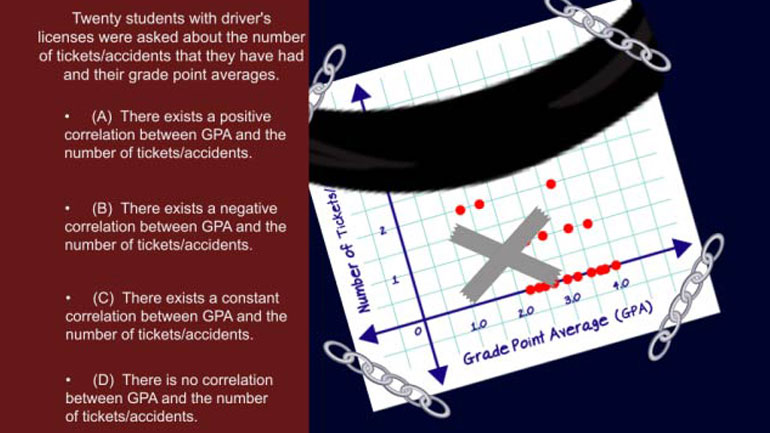
Statistics, Data, and Probability II: Drill Set 6, Problem 3. Based on the graph, what can be said about a student with a 2.5 GPA?

Statistics, Data, and Probability II Drill 6 Problem 4. What conclusion can be drawn from the graph?

Statistics, Data, and Probability II Drill 6 Problem 5. This graph is an example of a scatter plot with a what?