ShmoopTube
Where Monty Python meets your 10th grade teacher.
Search Thousands of Shmoop Videos
Statistics, Data, and Probability II Videos 30 videos
CAHSEE Math Statistics, Data, and Probability II: Drill 1 Problem 1. Which of the following tables best represents the relationship between the val...
Statistics, Data, and Probability II Drill 1, Problem 2. Based on the chart, which of the following statements is true?
CAHSEE Math Statistics, Data, and Probability II: Drill Set 1, Problem 3. Based on the following, which of the following statements is true?
CAHSEE Math 6.4 Statistics, Data, and Probability II 188 Views
Share It!
Description:
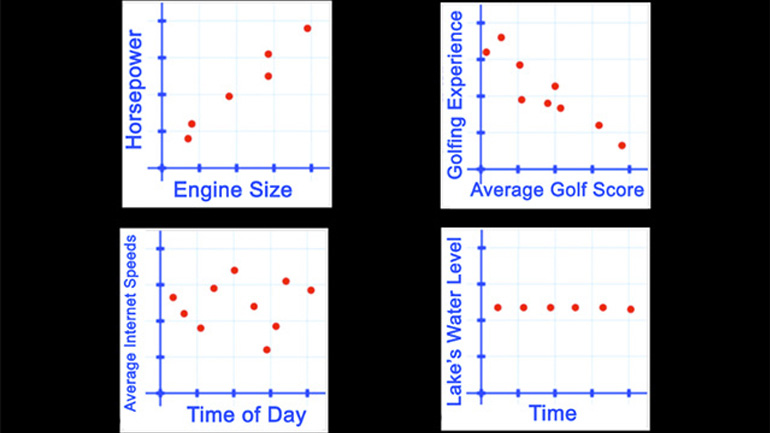
Statistics, Data, and Probability II Drill 6 Problem 4. What conclusion can be drawn from the graph?
- Statistics and Probability / Summarize, represent, and interpret data on two variables
- Statistics and Probability / Summarize, represent, and interpret data on two variables
- Statistics and Probability / Understand and evaluate random processes underlying statistical experiments
- Statistics and Probability / Make inferences and justify conclusions from sample surveys, experiments, and observational studies
- Statistics and Probability / Summarize, represent, and interpret data on two variables
- Statistics and Probability / Summarize, represent, and interpret data on two variables
- Statistics and Probability / Summarize, represent, and interpret data on two variables
- Statistics and Probability / Understand and evaluate random processes underlying statistical experiments
- Statistics and Probability / Make inferences and justify conclusions
- Mathematical Reasoning / Formulating conjectures
Transcript
- 00:04
Here’s your shmoop du jour…
- 00:06
Mark kept track of the time he spent online each month for the past year.
- 00:10
The truth can be scary. This guy likes his Minecraft.
- 00:14
The graph below shows the time Mark spent online in hours and the cost of the internet access.
- 00:19
What conclusion can be drawn from the graph?
Full Transcript
- 00:23
And here are the potential answers...
- 00:26
OK, so this question is a scatter plot that… isn’t very scattered.
- 00:29
It basically looks like the heart monitor of a guy whose heart isn’t… doing so hot.
- 00:34
Let’s just read through the potential answers and, hopefully, one should jump out at us.
- 00:38
A “He spends approximately the same amount of time online each month.”
- 00:43
Well – no – he’s all over the map from here to here… like 2 hours to about 65.
- 00:48
So A is false.
- 00:49
B “He is charged according to the time spent online.”
- 00:54
No – the dollar amounts basically never change – he clearly has the “all you can eat" plan.
- 01:01
C “He is charged the same no matter how much time he spends online.” Correctamundo.
- 01:08
D “He is charged according to how much he downloads.”
- 01:11
Fortunately for Mark… no he’s not.
- 01:13
Or else he’d have to field some pretty tough questions from his mother… and the family therapist.
- 01:22
So the answer is C.
- 01:23
We also would have accepted that the answer is… “Mark really needs to get a life.”
Related Videos
CAHSEE Math: Algebra and Functions Drill 5, Problem 3. Solve the equation.
Statistics, Data, and Probability I: Drill Set 3, Problem 4. How many different avatars can be created based on the given options?
Statistics, Data, and Probability II Drill 3 Problem 2. Which two sports together make up for the preferences of more than half of all those w...
Statistics, Data, and Probability II Drill 3 Problem 3. One hundred twenty of those who were asked preferred what sport?


