ShmoopTube
Where Monty Python meets your 10th grade teacher.
Search Thousands of Shmoop Videos
Summarize, represent, and interpret data on a single variable Videos 5 videos
Statistics, Data, and Probability I: Drill Set 1, Problem 4. How old was the final person to join?
Data doesn't do us much good if we can't interpret it. Ever snuck into a CPA's office while he slips out for a coffee break and tried to decipher o...
SAT Math 1.1 Statistics and Probability 289 Views
Share It!
Description:
SAT Math 1.1 Statistics and Probability. In which of the following data sets are the arithmetic mean and the median equal?
- Statistics / Median
- Product Type / SAT Math
- Mathematics and Statistics Assessment / Probablistic Reasoning
- Statistics and Probability / Summarize, represent, and interpret data on a single variable
- Statistics and Probability / Summarize, represent, and interpret data on a single variable
- Statistics and Probability / Summarize, represent, and interpret data on a single variable
- Statistics and Probability / Summarize, represent, and interpret data on a single variable
- Problem Solving and Data Analysis / Data collection and evaluation
Transcript
- 00:02
You can't handle the Shmoop!
- 00:06
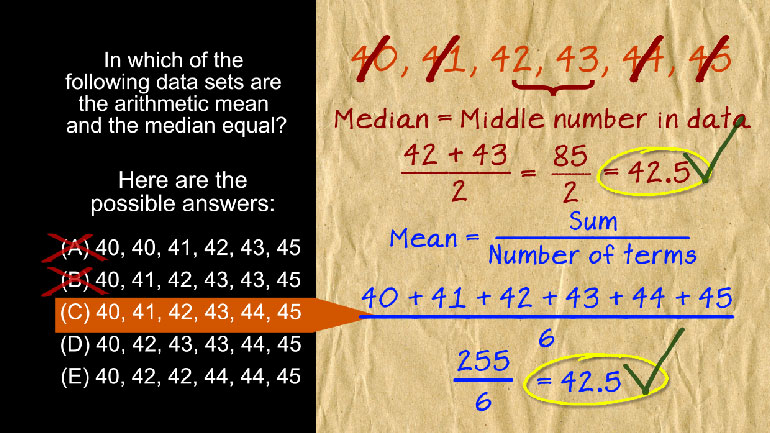
In which of the following data sets are the arithmetic mean and the median equal?
- 00:11
And here are the potential answers…
- 00:15
To solve this problem, we just have to compare the mean and median
- 00:18
in each of the answer choices, until we find a match.
Full Transcript
- 00:22
Remember that we can find the arithmetic mean, a fancy term for average, by adding up all
- 00:27
of the values, and dividing by the total number of values we've added.
- 00:32
The median is simply the value in the middle of all of the data.
- 00:37
In the answer choices given, there are 6 values, so there’s no one single value in the middle.
- 00:42
When this happens, we take the midpoint of the two middle values.
- 00:46
Let's start looking at our answers. In data set A, we have 40, 40, 41, 42, 43, and 45.
- 00:53
To find the median, we cross out the min and the max values.
- 00:56
Then we do it again. We’re left with two values, so the mean of the two is the median.
- 01:01
Between 41 and 42 is 41.5.
- 01:04
Now for the mean. We add up all of the values, and get 251. Then, we divide by 6 to get 41.833.
- 01:12
The mean is 41.83, and the median is 41.5. They’re not the same.
- 01:18
So we can cross off answer choice A. Our next set is 40, 41, 42, 43, 43, 45.
- 01:25
Applying the same method to find the median, we get 42.5.
- 01:29
When we find the mean, we add up our numbers to get 254, and divide by 6 to get 42.3.
- 01:35
Still not the same. Onto C, which is 40, 41, 42, 43, 44, 45.
- 01:40
The median is 42.5.
- 01:42
When we add up all of the values, we get 255. When we divide by 6, we get 42.5.
- 01:49
The mean and median of C is the same. We’ve found our answer.
Related Videos
SAT Math 2.1 Geometry and Measurement. What is the measure of angle z in terms of x and y?
In 2014, the unemployment rate of one county in California was 7%. In another county, the unemployment rate was 11%. Which of the following express...
Angela is making cookies for a bake sale. She expects each batch of her cookies to sell for $40. It costs her $10 to make one batch of cookies, and...


