ShmoopTube
Where Monty Python meets your 10th grade teacher.
Search Thousands of Shmoop Videos
GED Math Videos 68 videos
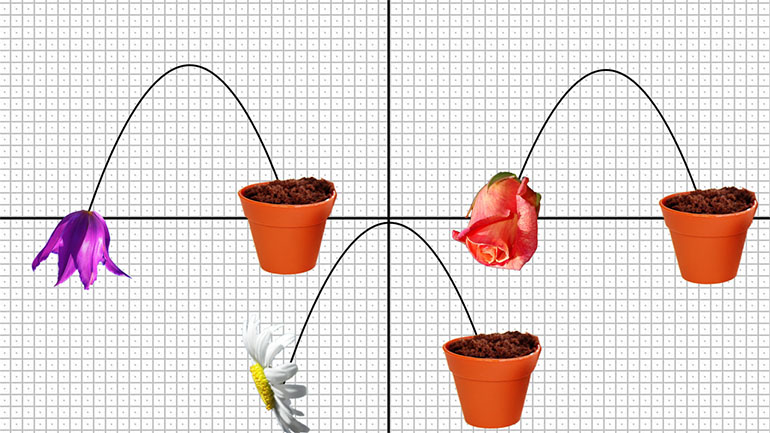
GED Math 1.1 Graphs and Functions. Which is the appropriate region of the coordinate plane?
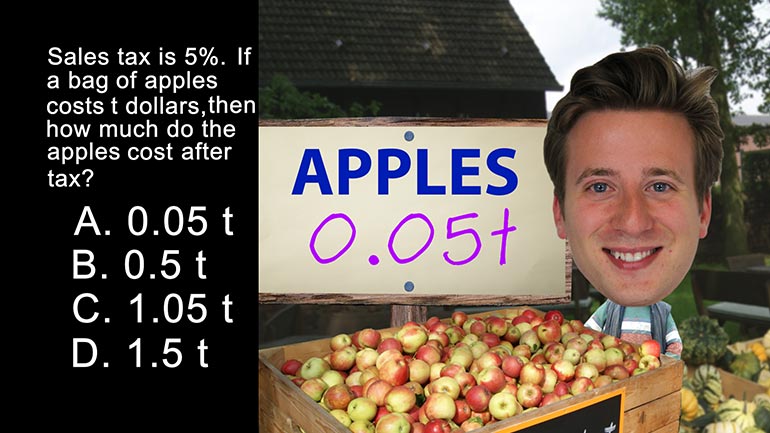
GED Math: Expression and Equations Drill 1, Problem 1. How much do the apples cost after tax?
GED Math: Measurement Drill 1, Problem 1. The area, in square inches, of the shaded region where the two rectangles overlap is...what?
GED Math 2.2 Measurement 200 Views
Share It!
Description:
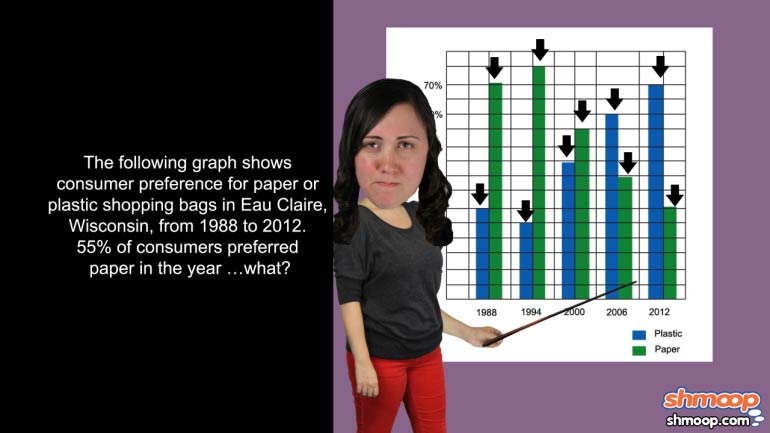
GED Math: Measurement Drill 2, Problem 2. 55% of consumers preferred paper in the year...what?
- Statistics and Probability / Summarize, represent, and interpret data on two variables
- Statistics and Probability / Summarize, represent, and interpret data on two variables
- Statistics and Probability / Summarize, represent, and interpret data on two variables
- Statistics and Probability / Summarize, represent, and interpret data on two variables
- Statistics and Probability / Summarize, represent, and interpret data on two variables
- Skill Area 4 / Graphs and Functions (Algebraic)
Transcript
- 00:00
Thank you We sneak in and here's your shmoop du
- 00:06
jour brought to you by paper or plastic Both pretty
- 00:09
bad off motorcycle helmet following graph shows consumer preference for
- 00:15
paper plastic shopping bags in oh claire wisconsin from nineteen
- 00:18
eighty eight to two thousand twelve Fifty five percent of
Full Transcript
- 00:21
consumers preferred paper in the year or what already This
- 00:28
is really testing nothing more than our graph free ability
- 00:31
And we read the numbers below and to decide sure
- 00:35
And we see a bunch pretty green and blue bars
- 00:38
on a grid You're okay Well looks like we're going
- 00:40
to find here All right This question wants to know
- 00:43
the year in which fifty five percent of consumers preferred
- 00:46
paper Well eyeballing our graph way See that demand for
- 00:51
paper bags has gone gradually down and demand for plastic
- 00:54
bags has gone up way to save the environment with
- 00:57
johnson The percentage are listed along the left hand side
- 01:01
here and we're only interested in the fifty five percent
- 01:03
No it has to be this line right here in
- 01:05
between fifty and sixty And following it to the right
- 01:08
We see it hits the tippy top of this green
- 01:10
Bar right chair Well sure enough into our legend Green
- 01:14
represents paper So we just check to see what year
- 01:17
were at And it looks like it's the year two
- 01:19
thousand interesting fact that's Also the year the residents of
- 01:23
eau claire wisconsin decided to just give up completely and
- 01:26
start a nuclear waste pile in the middle of town 00:01:28.336 --> [endTime] square
Related Videos
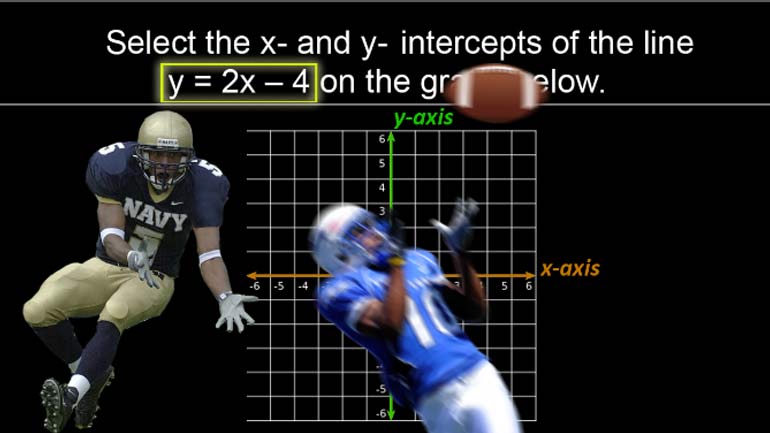
GED Math: Graphs and Functions Drill 5, Problem 5. What is the value of a?
GED Math: Measurement Drill 1, Problem 1. The area, in square inches, of the shaded region where the two rectangles overlap is...what?
GED Math 1.1 Graphs and Functions. Which is the appropriate region of the coordinate plane?
GED Math: Expression and Equations Drill 1, Problem 1. How much do the apples cost after tax?

