ShmoopTube
Where Monty Python meets your 10th grade teacher.
Search Thousands of Shmoop Videos
Conflicting Viewpoints Videos 15 videos


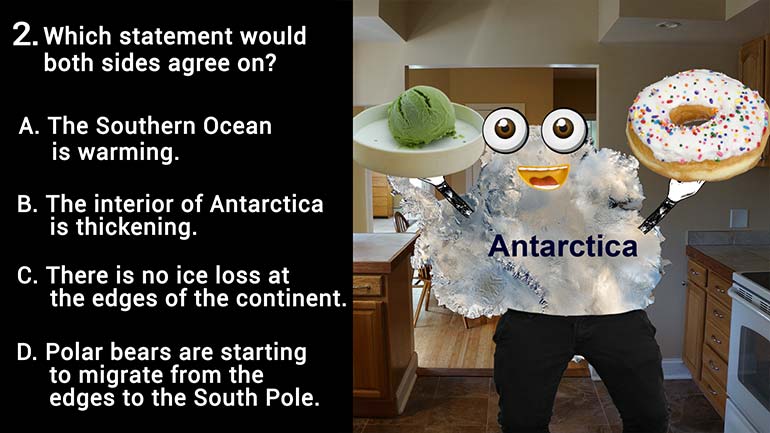


Which of the following would both scientists agree on?

Which of the following health effects did Scientist 1 NOT mention?

Which of the following would best convince Scientist 2 to re-examine Scientist 1's work?
ACT Aspire Science: Ice Ice Baby 1 Views
Share It!
Description:
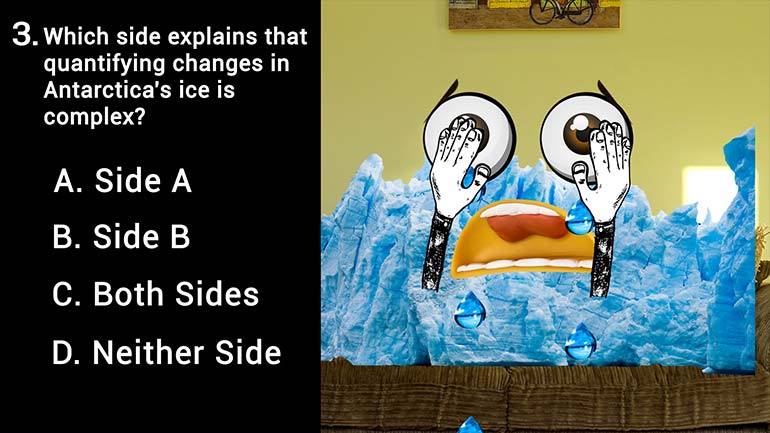
Which side explains that quantifying changes in Antarctica's ice is complex?
Transcript
- 00:00
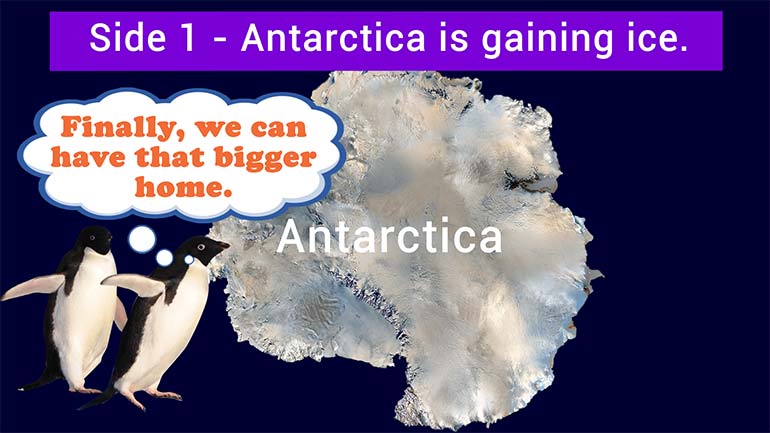
Yeah Oh okay Next up here we go The way
- 00:08
of things The loss of ice in the West Haven't
- 00:12
you think about that A lot of things like that
- 00:16
Which side explains that quantifying changes in Antarctica's ice is
- 00:22
come flex All right well let's think about this side
Full Transcript
- 00:28
A thinks that melting sea ice and increasing land ice
- 00:33
can basically be thought about in relation to one another
- 00:36
right It's all the same difference because well the ice
- 00:39
loss and new ice average average out to about the
- 00:42
same amount of ice overall Kind of Yeah that's how
- 00:46
he talked All right Well side B in contrast has
- 00:49
set the Facebook status for this relationship to It's complicated
- 00:53
now were so intrigued Side B tell us more well
- 00:56
side be mentions how complex it is to study and
- 00:59
understand the factors affecting Antarctica Land ice has its own
- 01:03
melting and freezing thing going on Sometimes it's got a
- 01:06
net zero loss of ice because all its melting and
- 01:09
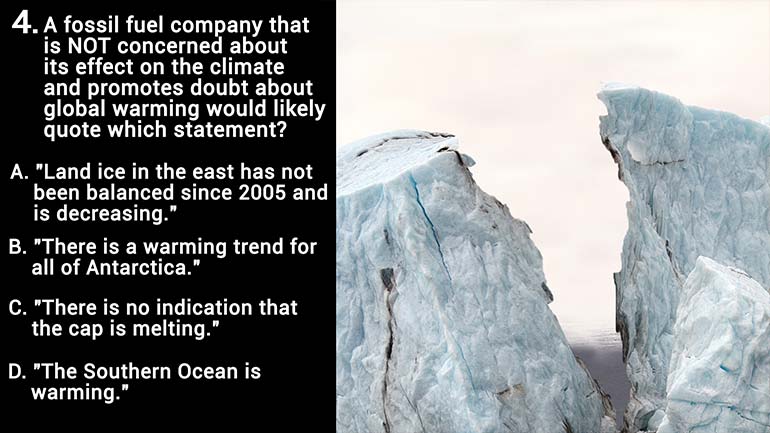
freezing ultimately balances out But well since two thousand six
- 01:14
it's been having more of a meltdown Yeah we're not
- 01:16
so sure This so called relationship is good for your
- 01:19
mental health their land ice well Meanwhile sea ice has
- 01:23
been showing growth even though the Southern Ocean is getting
- 01:27
warmer We'll putting land and sea ice together in one
- 01:30
bucket and concluding everything is hunky Dorey Well side B 00:01:34.68 --> [endTime] thinks not So you have The answer is B
Related Videos
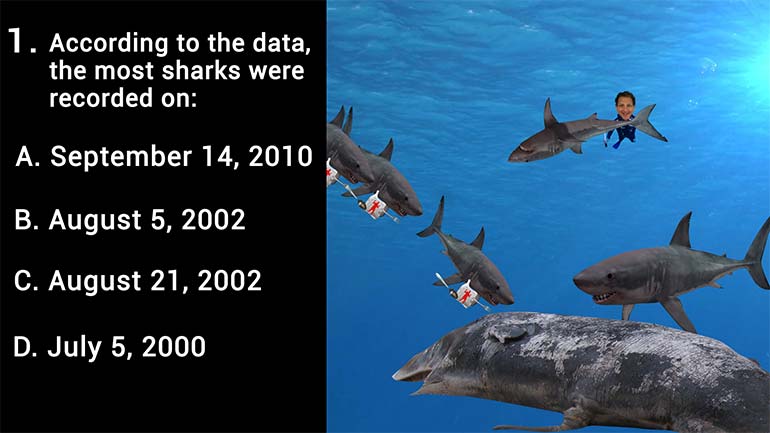
According to the data, the most sharks were recorded on:
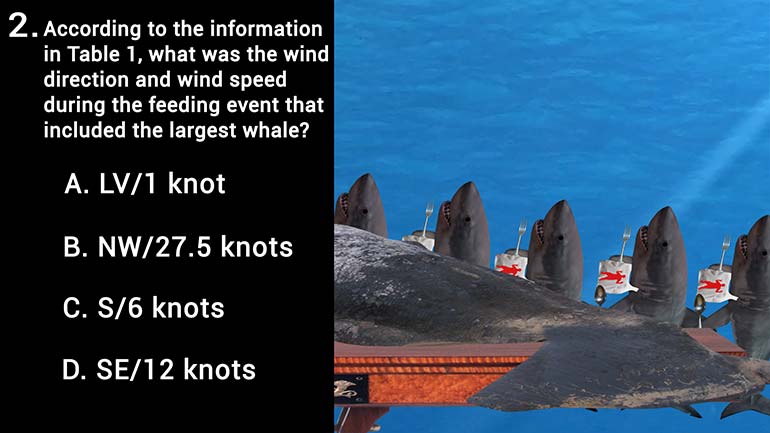
According to the information in Table 1, what was the wind direction and wind speed during the feeding event that included the largest whale?
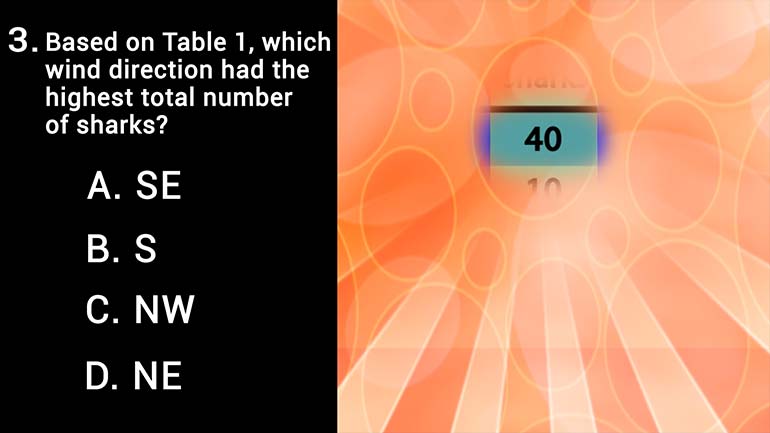
Based on Table 1, which wind direction had the highest total number of sharks?

According to the information in Figure 1, what is the maximum shark size for a wind speed of ~18 knots?
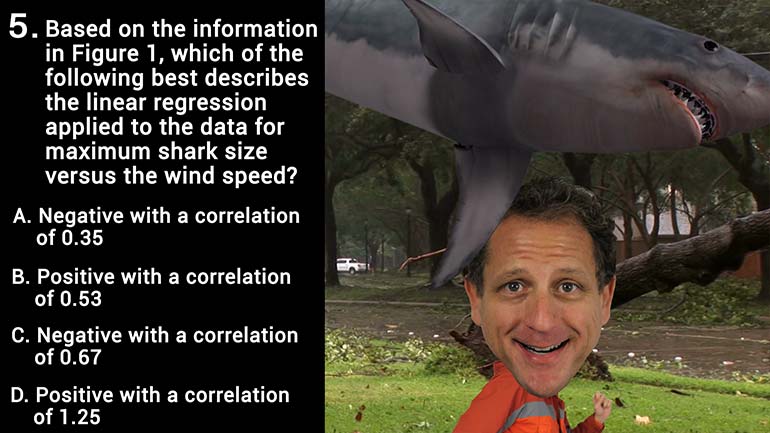
Based on the information in Figure 1, which of the following best describes the linear regression applied to the data for maximum shark size versus...