ShmoopTube
Where Monty Python meets your 10th grade teacher.
Search Thousands of Shmoop Videos
Interpreting Categorical and Quantitive Data Videos
Play All
Data doesn't do us much good if we can't interpret it. Ever snuck into a CPA's office while he slips out for a coffee break and tried to decipher o...

Statistics, Data, and Probability I: Drill Set 3, Problem 4. How many different avatars can be created based on the given options?

Statistics, Data, and Probability I: Drill Set 3, Problem 5. What is the probability that the sum of the two rolls adds up to 9?

Statistics, Data, and Probability I: Drill Set 6, Problem 5. What is the probability that the man will first pick a brown eyeball and then a white...

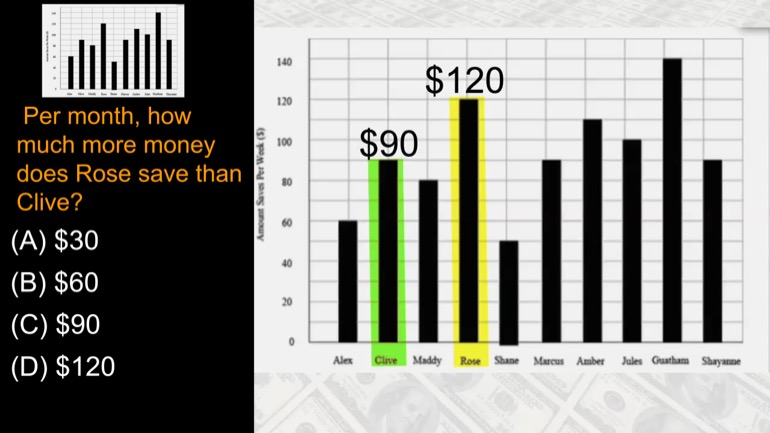
Per month, how much more money does Rose save than Olive?
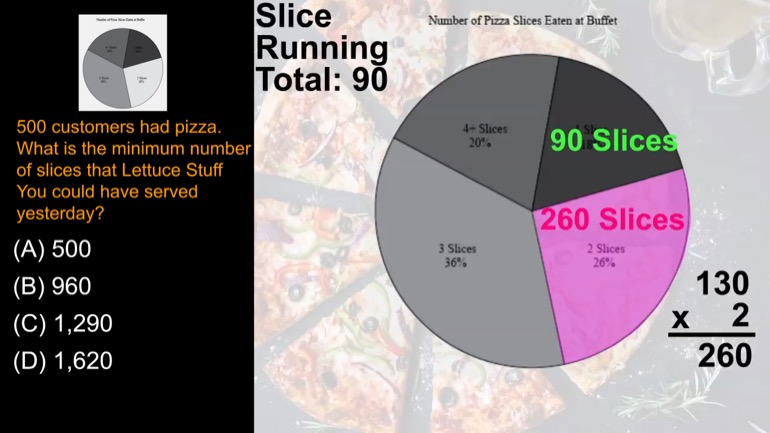
500 customers had pizza. What is the minimum number of slices that Lettuce Stuff You could have served yesterday?

The following table shows the coffee preferences of everyone in Isabelle's office. What percentage of Isabelle's coworkers put cream in their coffee?

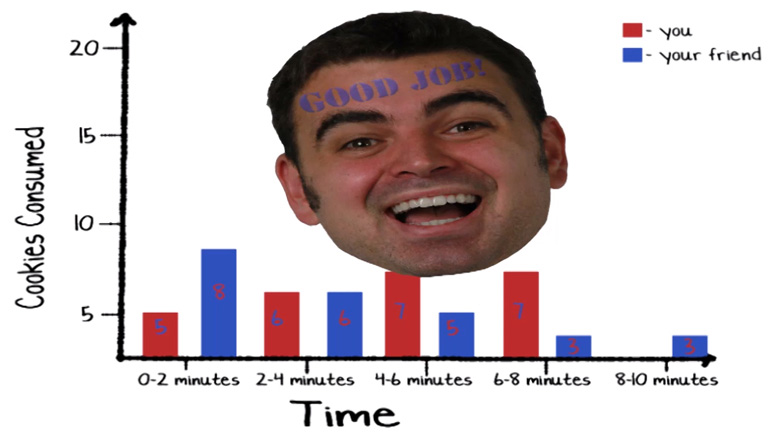
Each minute of studying increased Wendy's quiz grade by approximately how many points?
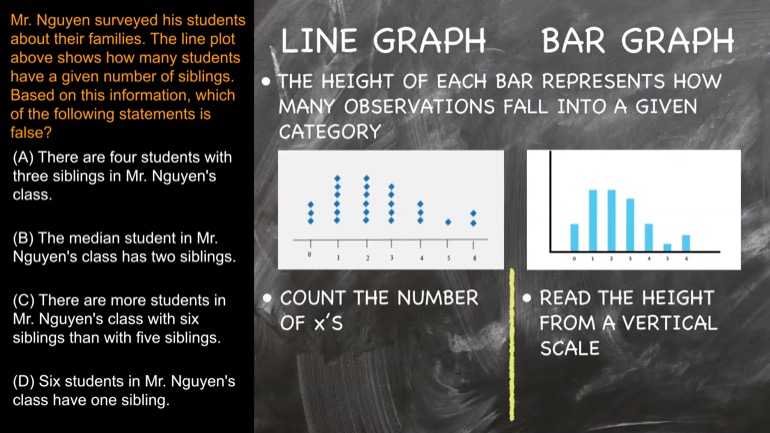
Mr. Nguyen surveyed his students about their families. The line plot above shows how many students have a given number of siblings. Based on this i...
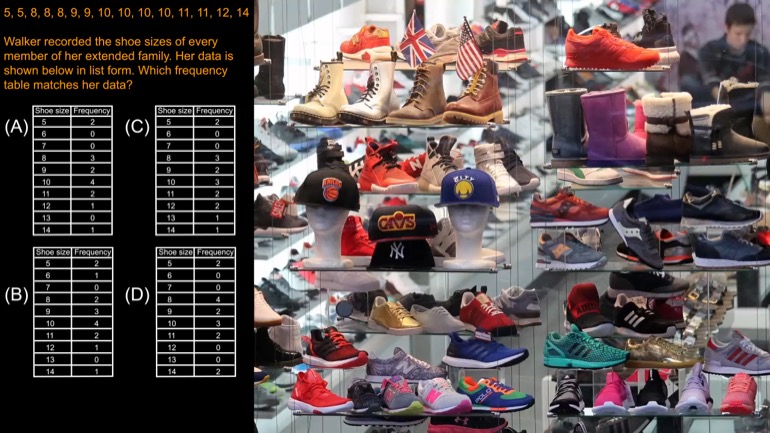
Walker recorded the shoe sizes of every member of her extended family. Her data is shown below in list form. Which frequency table matches her data...

Using the formula for standard deviation , find s for the following set of data:0, 8, 9, 13, 14
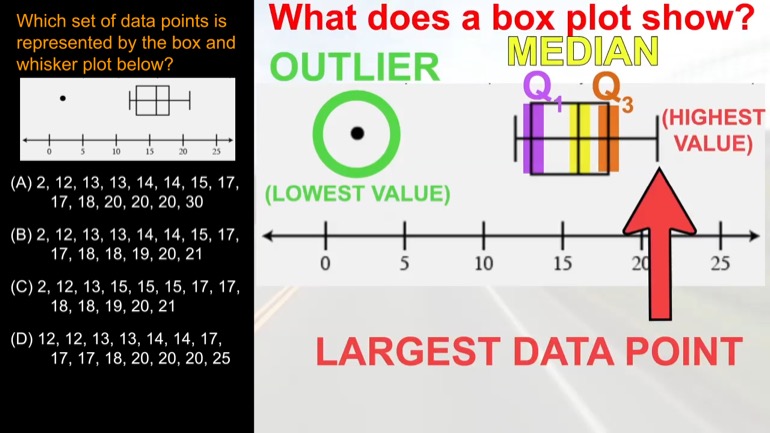
Which set of data points is represented by the box and whisker plot below?
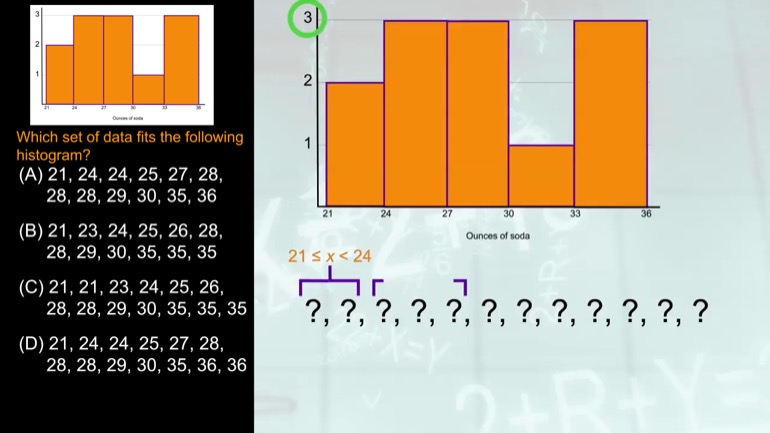
Which set of data fits the above histogram?

In this list of student test scores: 82, 71, 94, 88, 79, 85, and 92, what are the three quartiles?

Find the interquartile range of this set of numbers: 92, 34, 15, 101, 113, 78, and 65.
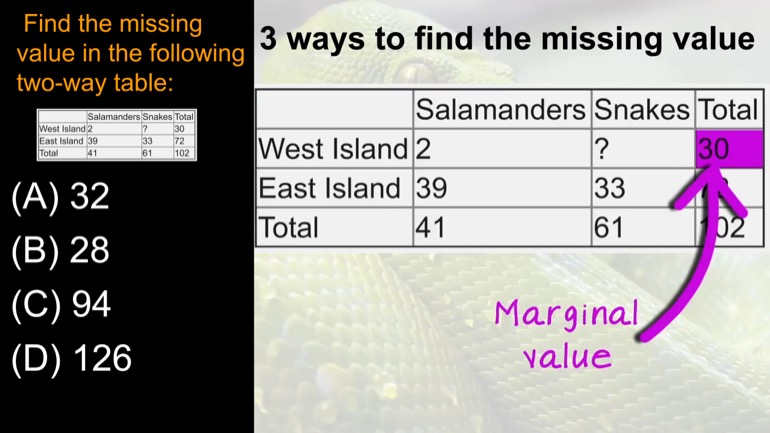
Find the missing value in the two-way table