ShmoopTube
Where Monty Python meets your 10th grade teacher.
Search Thousands of Shmoop Videos
Graphs of Univariate Data Distributions Videos
Play All

AP Statistics: Exploring Data Drill 1, Problem 2. Which of the following is the best way to display this type of data?
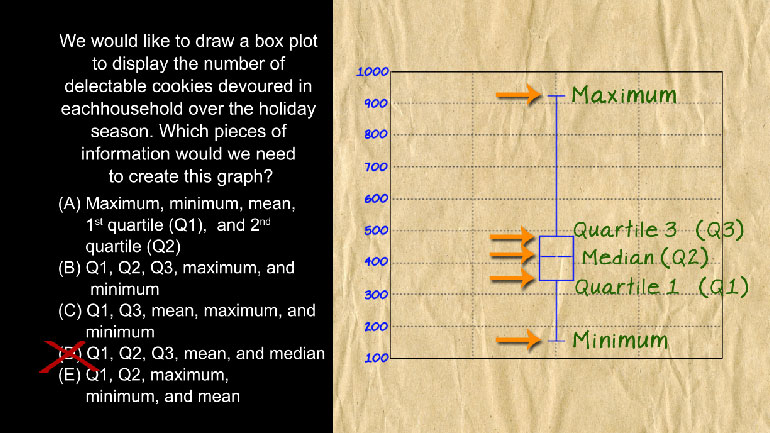
AP Statistics: Exploring Data Drill 1, Problem 5. Which pieces of information would we need to create this graph?
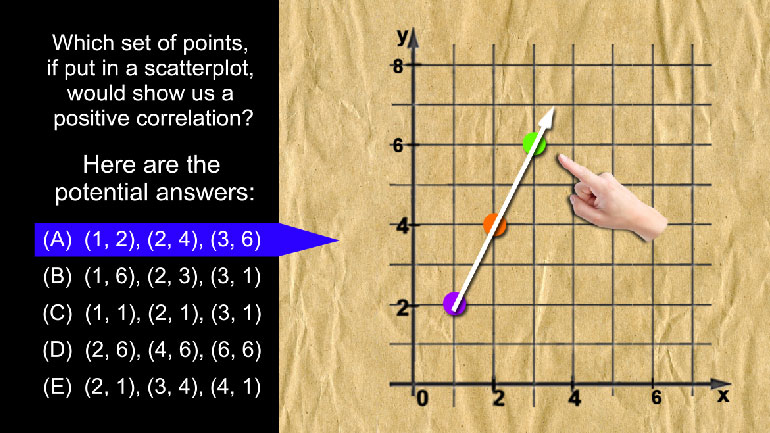
AP Statistics: Exploring Data Drill 2, Problem 3. Which set of points, if put in a scatterplot, would show us a positive correlation?
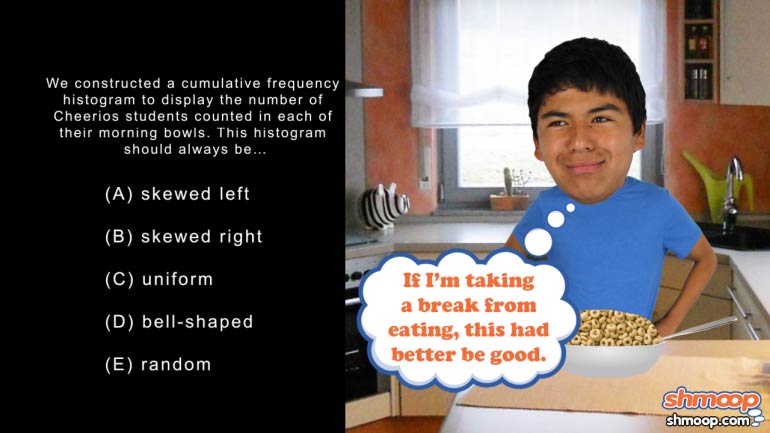
AP Statistics 1.1 Exploring Data. What should this histogram always be?
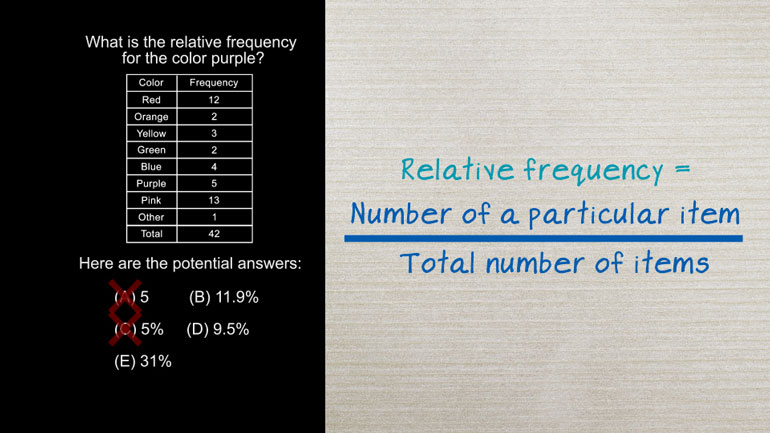
AP Statistics 5.5 Exploring Data. What is the relative frequency for the color purple?