ShmoopTube
Where Monty Python meets your 10th grade teacher.
Search Thousands of Shmoop Videos
Representing and interpreting data in charts, tables, and graphs Videos
Play All
ACT Math 2.5 Pre-Algebra
425 Views
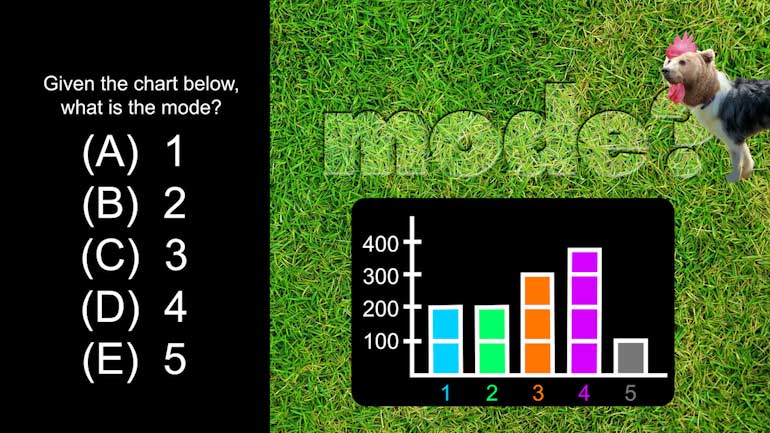
ACT Math Pre-Algebra Drill 2, Problem 5. Given the chart in the video, what is the mode?