ShmoopTube
Where Monty Python meets your 10th grade teacher.
Search Thousands of Shmoop Videos
Data Representation Videos
Play All
According to the information in Figure 1, what is the maximum shark size for a wind speed of ~18 knots?
According to the information in Figure 1, what is the youngest unit of the Sharps Formation appearing in Nebraska when moving south from South Dako...
According to the information in Figure 1, what is the experimental time for the peak that has a value of 1.0 for relative strength?
According to the data, the most sharks were recorded on:
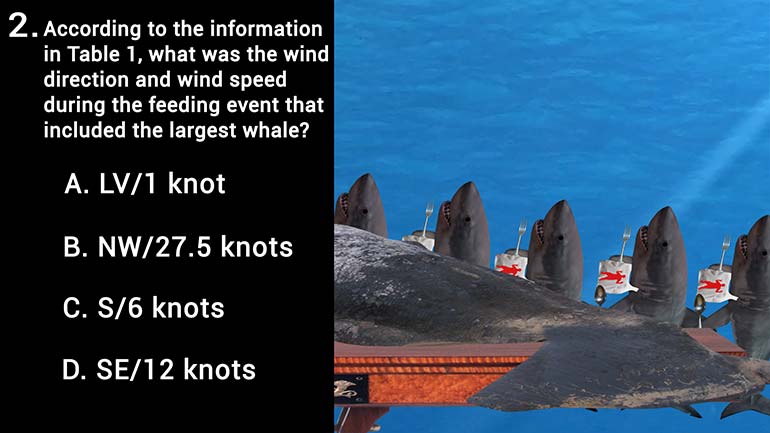
According to the information in Table 1, what was the wind direction and wind speed during the feeding event that included the largest whale?
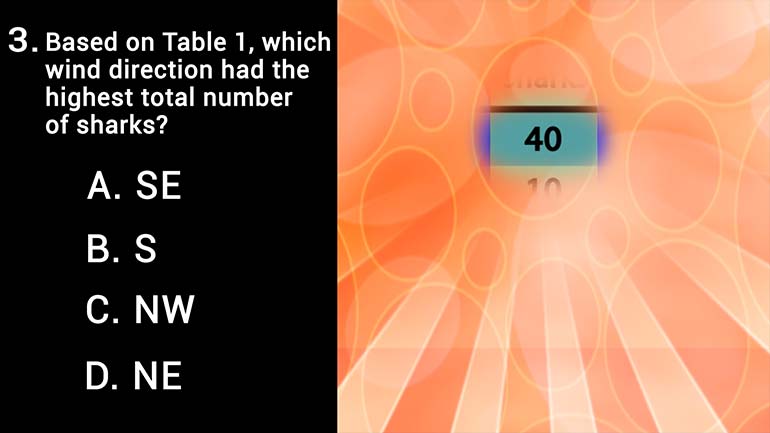
Based on Table 1, which wind direction had the highest total number of sharks?
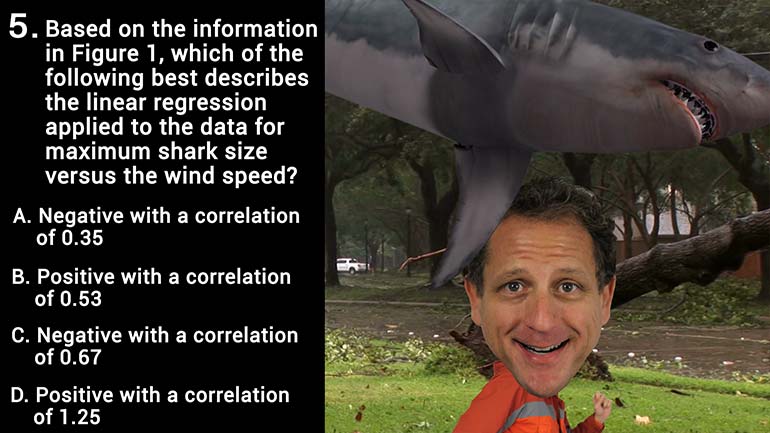
Based on the information in Figure 1, which of the following best describes the linear regression applied to the data for maximum shark size versus...

Based on the information in Figure 1, the Sharps Formation is located in which epoch?

Which of the following conclusions is best supported by the data?
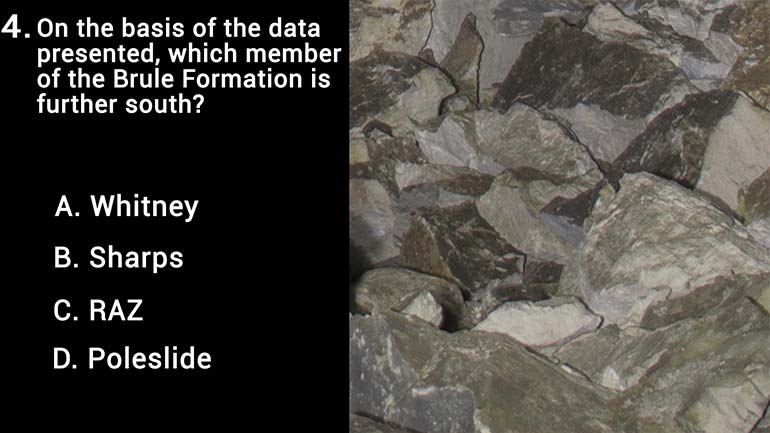
On the basis of the data presented, which member of the Brule Formation is further south?

According to the data, in which NALMA does the Gering Formation occur?

Based on Figure 1, the maximum relative strength value of a small-scale wave is:
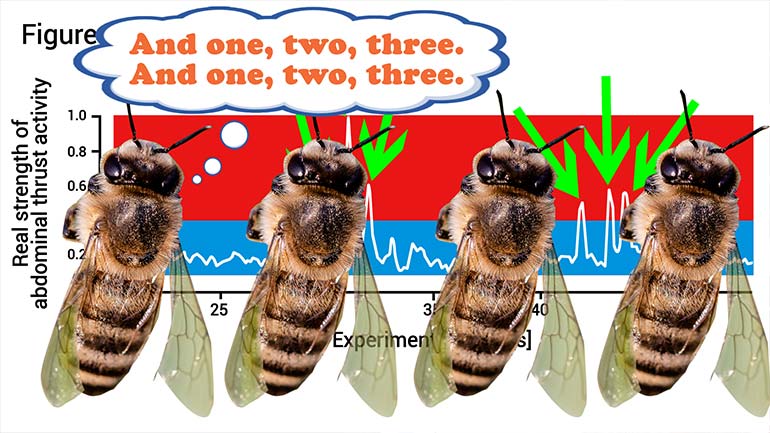
On the basis of the data presented, how many times was a big-scale wave generated over the experimental time?
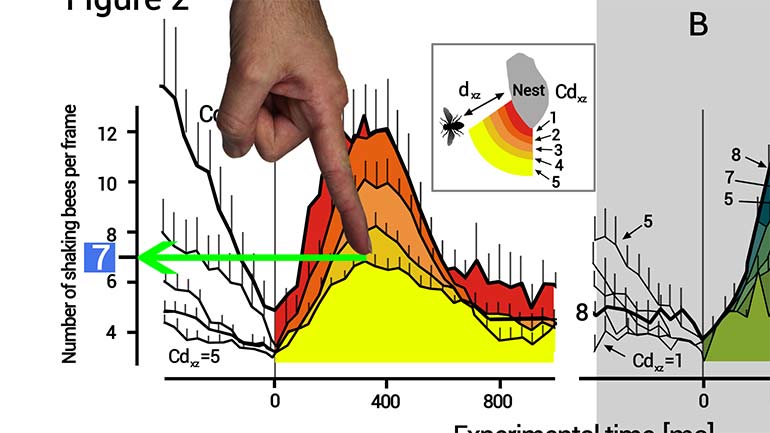
According to the information in Figure 2, what is the maximum number of bees observed in a frame at a Class 5 distance?
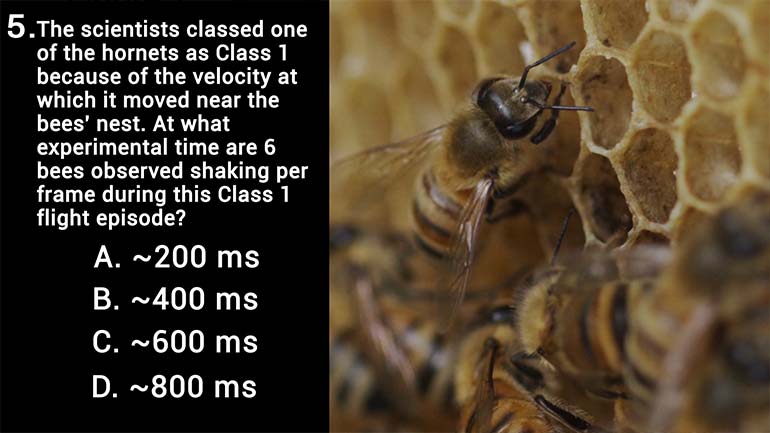
The scientists classed one of the hornets as Class 1 because of the velocity at which it moved near the bees' nest. At what experimental time are 6...