ShmoopTube
Where Monty Python meets your 10th grade teacher.
Search Thousands of Shmoop Videos
Statistics Videos
SAT Math 6.1 Geometry and Measurement
Charts, Graphs, and Tables Videos 60 videos


This video covers how to set up a stem and leaf plot and use it to find the mean and median of a set of numbers.


Knock-Knock. ¡Histograma cantante! Aquí para cantarte a tí acerca de toda la alegría y maravillas de lo que hacemos. ¿Te interesaría adquirir...
Designing a Study Videos 1 videos

If you're looking for tips on how to score more free samples at Yogurtland, you've got the wrong video.
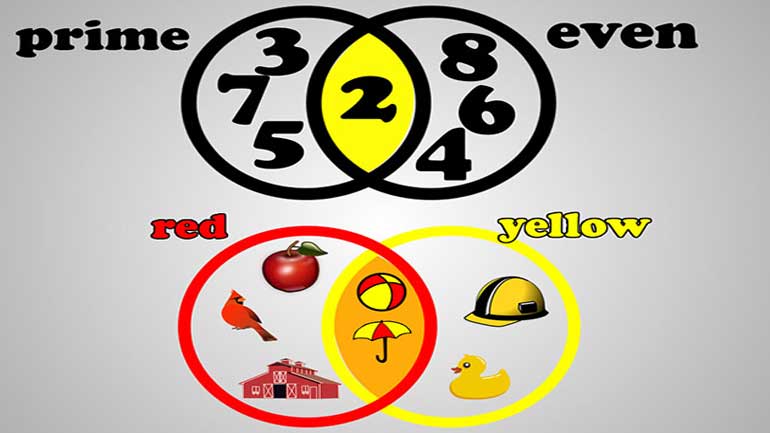
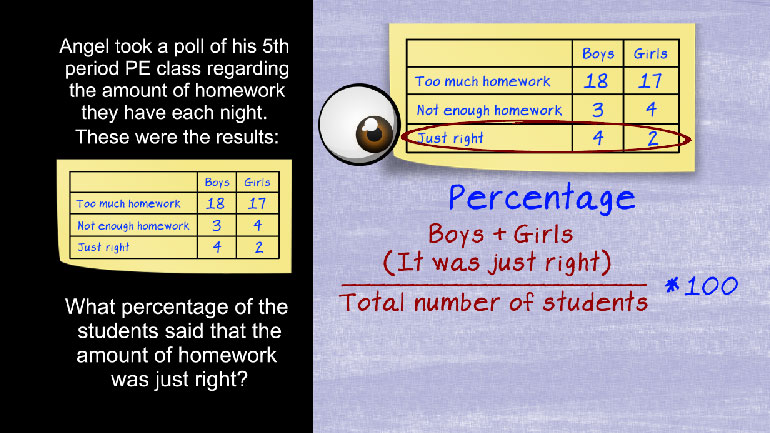
Evaluating Data Videos 6 videos


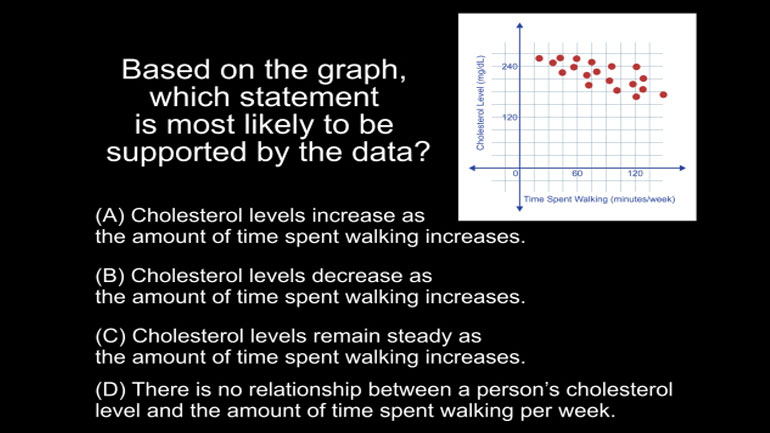
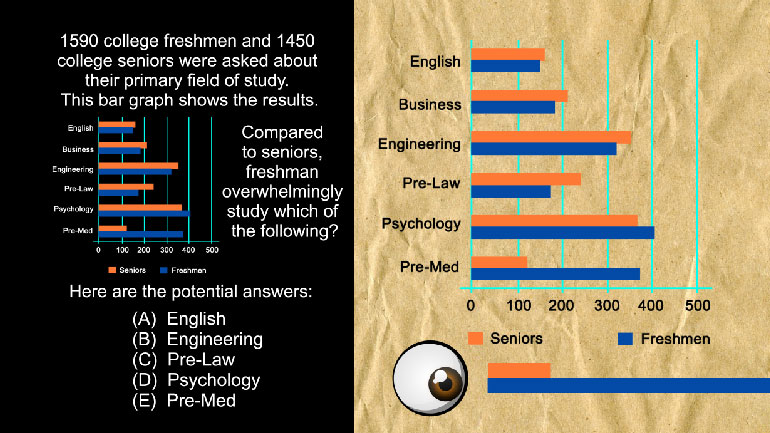
Statistics, Data, and Probability II Drill 4 Problem 2. Based on the graph, which statement is most likely to be supported by the data?

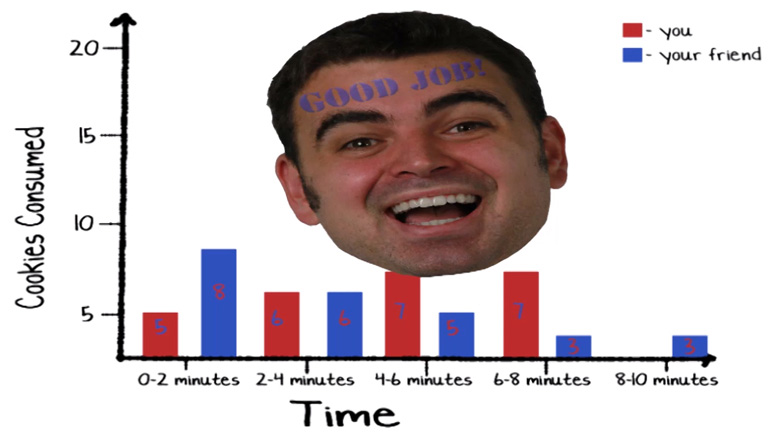
Statistics, Data, and Probability II Drill 6 Problem 4. What conclusion can be drawn from the graph?
Factorials Videos 1 videos

Do you have trouble organizing your desk? Are your bookshelves a disaster area? Well, you’re in luck! Act now, and get yourself a pack of factori...
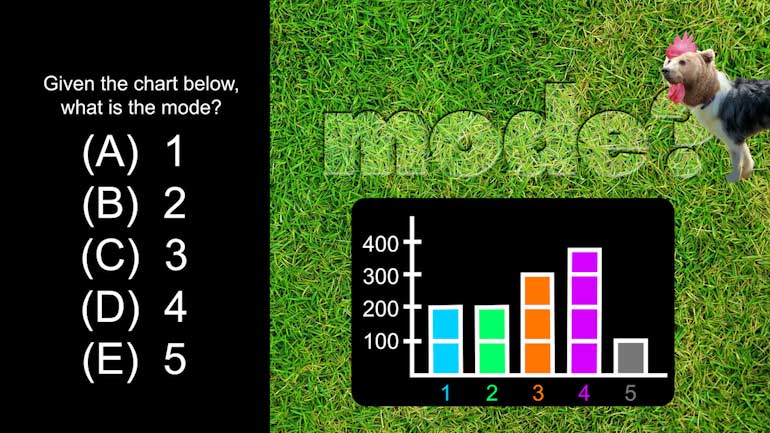
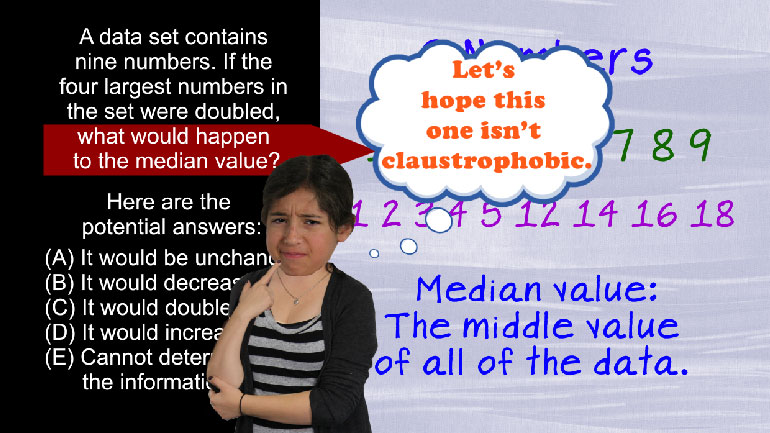
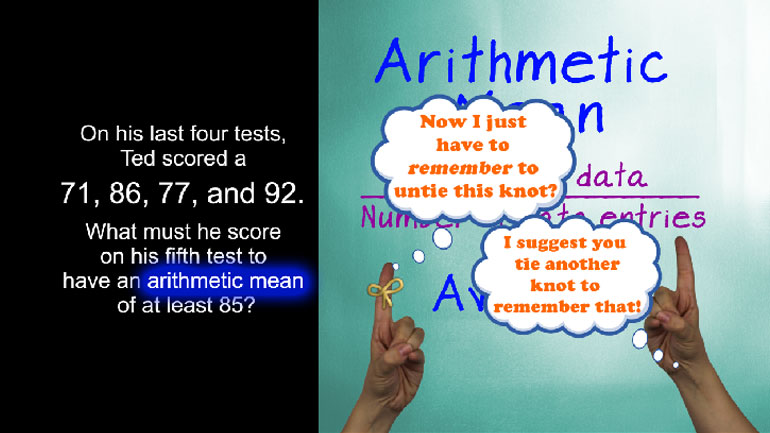
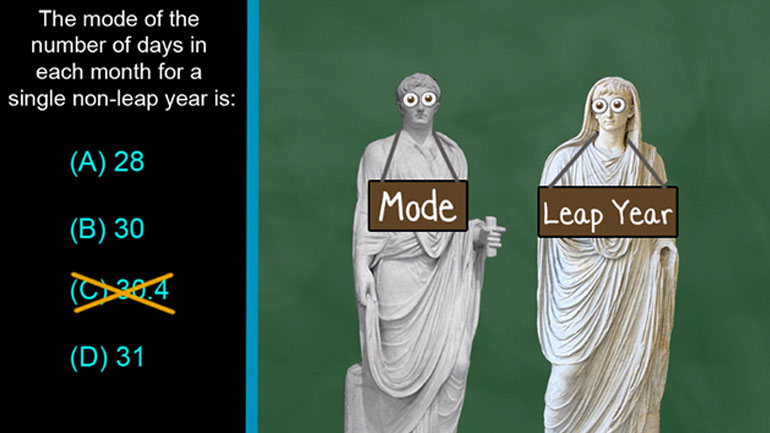
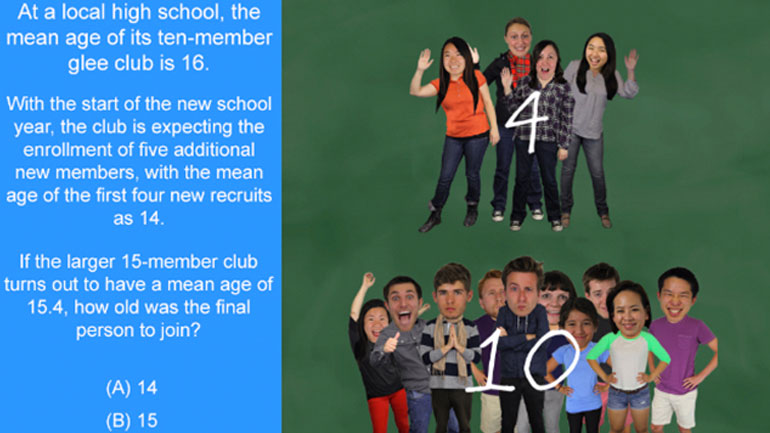
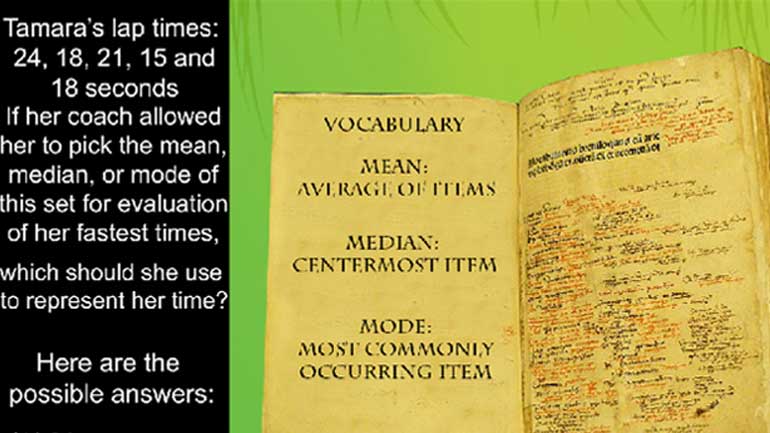
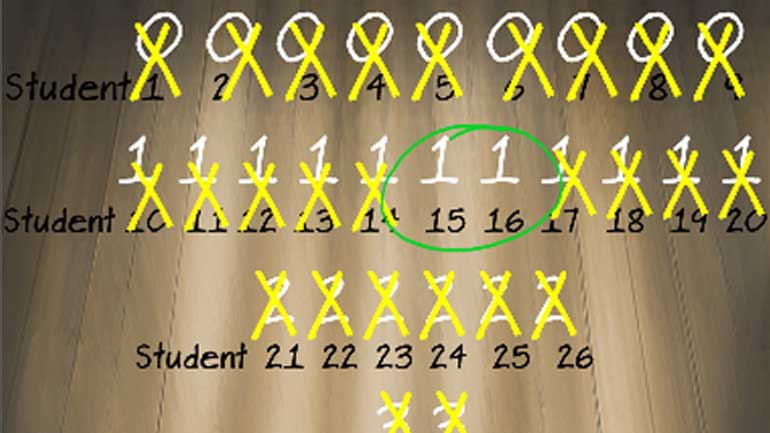
Mean, Median, and Mode Videos 18 videos


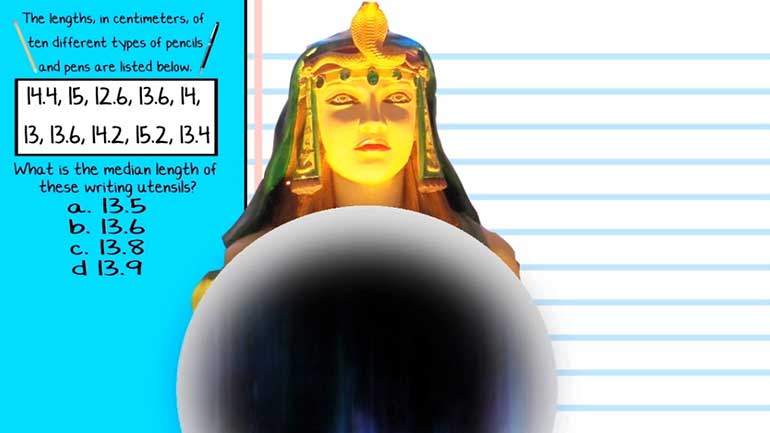


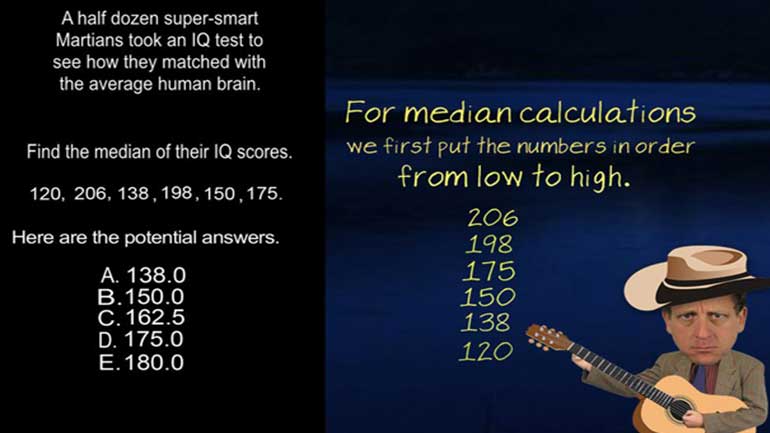
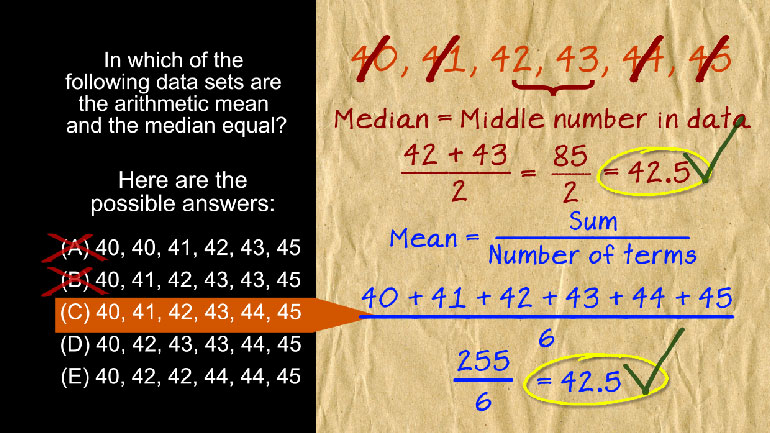
ACT Math Section: Pre-Algebra Drill 1, Problem 4. Can you find the median?